





What predictive analytics in ecommerce is, 7 uses that pay off, ML customer segmentation, and the Shopify, Klaviyo and GA4 tools with their data minimums.
You already know your best customers. You can name the ones who order every six weeks, the ones who only buy on sale and the ones who bought once in March and vanished. The trouble is that you know it a month too late, when the reorder window has closed and the lapsed buyer has found another brand.
That isn't a reporting problem. Your dashboards are fine. It's a timing problem: everything in them describes what already happened, and every decision you make from them arrives after the moment it could have changed.
Predictive analytics flips the order. This guide explains what predictive analytics in ecommerce actually is, the seven uses that pay off for a Shopify brand, how machine learning customer segmentation works, which tools you already have that do it, and how much order data each one needs before its predictions mean anything.
TL;DR
- Predictive analytics in ecommerce uses past order, browsing and engagement data to score what each customer or product is likely to do next: buy again, churn, spend more or sell out.
- Most Shopify brands already own the tools. Shopify's predicted spend tier, Klaviyo's predictive analytics and GA4's predictive metrics are built in. Each has a data minimum, and that minimum decides whether you can use it.
- The thresholds are specific: Shopify needs more than 100 sales, Klaviyo needs at least 500 paying customers and 180 days of order history, and GA4 needs 1,000 returning users who purchased and 1,000 who didn't inside a 7-day window (Shopify, Klaviyo and Google documentation, 2026).
- The payoff is real but bounded. McKinsey found personalization most often lifts revenue 10% to 15% (McKinsey, 2021), and AI forecasting cuts forecast errors 20% to 50% in supply chains (McKinsey, 2022). Every Man Jack, a Shopify Plus brand, earns 12.4% of its Klaviyo-attributed revenue from predictive segments (Klaviyo).
- Prediction without a channel does nothing. The score is only useful if it triggers a message, an offer or a stock order at the right moment.
What is predictive analytics in ecommerce?
Predictive analytics in ecommerce is the use of historical store data and statistical or machine learning models to estimate what a customer or product will do next. It answers forward-looking questions: who will buy again in the next 30 days, who is about to lapse, which SKU will sell out before the next purchase order lands.
The inputs are data you already collect. Order history, average order value, time between orders, product views, email and push engagement, returns. The output is a score attached to a customer or a product, such as "72% likely to purchase in the next 7 days" or "predicted next order date: 14 December."
A score on its own changes nothing. The value comes when you wire it to an action, like a reorder reminder sent two days before the predicted date.
How is predictive analytics different from descriptive and prescriptive analytics?
Descriptive analytics tells you what happened, predictive analytics tells you what will probably happen, and prescriptive analytics recommends what to do about it. Most Shopify reports are descriptive. Predictive scores are the step that lets you act before the event instead of after it.
| Type | Question it answers | Shopify example | Typical tool |
|---|---|---|---|
| Descriptive | What happened? | Last month's repeat purchase rate was 22% | Shopify Analytics, GA4 reports |
| Diagnostic | Why did it happen? | Repeat rate fell because the subscription offer ended | Cohort and funnel reports |
| Predictive | What will probably happen? | 1,400 customers are likely to reorder within 14 days | Klaviyo predictive analytics, Shopify predicted spend tier, GA4 predictive metrics |
| Prescriptive | What should we do? | Send a reorder push to that group on day 12, no discount | Flow builders, AI assistants with human approval |
The repeat-rate figures in the table are illustrative. The pattern holds for any store.
How does predictive analytics work in an online store?
It works in four steps: collect behavioral and order data, train a model on customers whose outcomes you already know, score current customers with that model, then trigger an action from the score. The model learns patterns like "customers who reorder usually do it 40 to 50 days after their second order" and applies them to people still mid-journey.
- Collect. Orders, line items, refunds, sessions, product views, email and push clicks. Clean data matters more than clever models. Shopify's own guide lists clean data as the first challenge for a reason.
- Train. The model looks at past customers and what they did next. Common methods include regression for spend, survival models for "time until next order" and classification models for churn.
- Score. Every current customer gets a probability or a predicted value, refreshed daily or weekly. GA4, for example, generates predictive metrics for each active user once per day (Google Analytics Help, 2026).
- Act. The score feeds a segment, a flow or a stock order. This is the step most brands skip.
{{cta}}
7 predictive analytics use cases for ecommerce
The seven uses that pay off for a Shopify brand are lifetime value prediction, next order timing, churn risk, purchase probability, demand forecasting, pricing and product recommendations. The first four live in your customer data and your retention channels. The last three touch inventory and merchandising.
1. Predicted customer lifetime value (CLV)
Predicted CLV estimates how much a customer will spend over a set future period. Use it to decide where acquisition money goes: if your high-value customers come mostly from one channel or one first product, that is where your next dollar should land. Our guide to increasing customer lifetime value covers the levers once you know who is worth it.
2. Predicted next order date
This is the most practical prediction for consumable brands. Instead of sending every reorder reminder on day 30, you send it just before each customer's own predicted date. Every Man Jack's retention team sets its reorder flow to send on, slightly before or after each customer's predicted next order date (Klaviyo case study).
3. Churn risk
Churn prediction flags customers whose gap since the last order is longer than their normal pattern. A customer who usually reorders every 35 days and is now on day 60 needs a different message from one who buys once a year. See our customer retention statistics for why keeping that buyer is cheaper than replacing them.
4. Purchase probability
Purchase probability scores how likely someone is to buy in a short window. GA4 defines it as the chance that a user active in the last 28 days logs a purchase in the next 7 days (Google Analytics Help, 2026). High scorers don't need a discount. Low scorers might not be worth one.
5. Demand forecasting
Demand forecasting predicts unit sales by SKU so you reorder before you stock out. McKinsey found AI-driven forecasting can cut forecast errors by 20% to 50% and lost sales from unavailability by up to 65% (McKinsey, 2022). We cover the tools in AI inventory management for ecommerce.
6. Pricing and markdown timing
Models that predict demand at different price points tell you when to mark down slow stock and when to hold full price. It's a separate discipline with real legal and brand risk, covered in our post on dynamic pricing AI.
7. Product recommendations
Recommendation engines predict which product a shopper is most likely to buy next, based on what similar shoppers bought. That logic drives "you might also like" rows, home screen feeds and post-purchase cross-sells. Our guide to AI merchandising goes deeper on sorting and feeds.
How does machine learning customer segmentation work?
Machine learning customer segmentation groups customers by patterns the model finds in their behavior, rather than by rules you write by hand. A rule-based segment says "spent over $200 in 90 days." A predictive segment says "likely to spend over $200 in the next 90 days," which includes people who haven't done it yet.
There are two common approaches:
- Clustering. Algorithms such as k-means group customers who look alike across many variables at once (recency, frequency, order value, categories bought, discount use). You then name the clusters: "full-price loyalists," "sale-only buyers," "one-and-done gift shoppers."
- Score-based tiers. The model ranks every customer on one predicted outcome and cuts the ranking into bands. Shopify's predicted spend tier is the clearest example: it sorts customers into high, medium and low tiers using how often they ordered, how many orders they placed, their average order value against your store average and how recently they last bought (Shopify Help Center).
The classic alternative is RFM (recency, frequency, monetary value), which is descriptive. RFM is a good starting point and still worth running. Predictive segmentation adds direction: two customers with the same RFM score can be heading opposite ways.
In Shopify, you can combine the tier with other filters in the segment editor. Shopify's own example is predicted_spend_tier = 'HIGH' AND email_subscription_status = 'SUBSCRIBED', which gives you high-value customers you're allowed to email (Shopify Help Center).
Predictive analytics examples from real brands
The best-documented examples come from retention marketing, because that is where the score and the action sit in the same tool. Here are two, plus one scenario to show the mechanics.
Every Man Jack (Shopify Plus, men's grooming). The brand uses Klaviyo's predicted next order date to time reorder flows per customer and sends campaigns to high predicted-CLV segments. Klaviyo reports that 12.4% of Every Man Jack's Klaviyo-attributed revenue in the last 90 days came from predictive analytics segments, with flow revenue up 25% year on year (Klaviyo case study).
Supply chain forecasting at scale. McKinsey's work on AI-driven forecasting found error reductions of 20% to 50% and up to 65% fewer lost sales from unavailability (McKinsey, 2022). The numbers come from large operations, so treat them as a ceiling for a mid-size Shopify brand, not a promise.
A before and after for a supplement brand. Picture a Shopify supplement store with a 60-day bottle. Before: every customer gets the same reminder on day 50, and the slow users ignore it because they still have a third of the bottle left. After: the store sends the reminder two days before each customer's predicted next order date, skips the discount for high-probability buyers and saves the offer for customers flagged as churn risks. Same list, same product, fewer discounts given away, and reminders that land when the bottle is actually running low.
Which predictive analytics tools can a Shopify store use?
A Shopify store can start with three tools it likely already has: Shopify's predicted spend tier, Klaviyo's predictive analytics and GA4's predictive metrics. Dedicated forecasting and pricing tools come later, once the basics are wired to actions.
| Tool | What it predicts | Minimum data to work | Where you act on it |
|---|---|---|---|
| Shopify predicted spend tier | High, medium or low future spend per customer | Store has made over 100 sales; only customers with a purchase are scored | Shopify customer segments, Shopify Email, apps that read segments |
| Klaviyo predictive analytics | Predicted CLV, expected next order date, churn risk, predicted gender | At least 500 customers with orders, 180+ days of order history, orders in the last 30 days, some customers with 3+ orders | Klaviyo segments and flows (email, SMS, and push through integrations) |
| GA4 predictive metrics | Purchase probability, churn probability, predicted revenue | In the last 28 days, over a 7-day period, 1,000+ returning users who purchased and 1,000+ who didn't | GA4 audiences shared to Google Ads |
| Demand forecasting apps | Unit sales by SKU and reorder points | Varies by app; check each app's history requirement | Purchase orders, low-stock alerts |
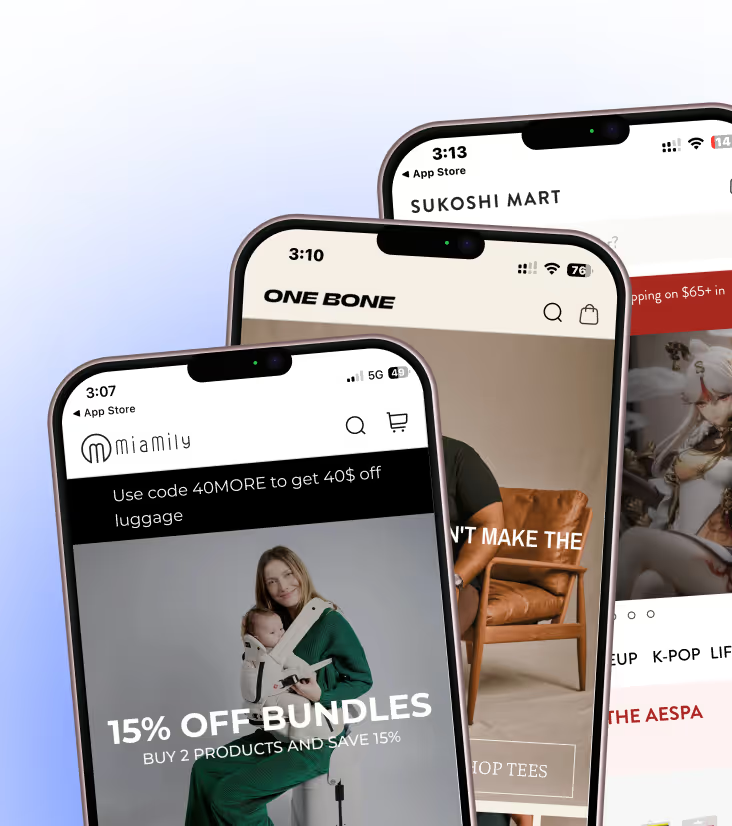
| Appbrew mobile app | Uses the segments above in app push and in-app content | Inherits the minimums of the source tool | Push campaigns and the app home screen |
Sources: Shopify Help Center, Klaviyo Help Center, Google Analytics Help (checked 12 November 2026).
The GA4 bar is the hardest to clear. Two thousand returning users split evenly between buyers and non-buyers in a single week rules out most stores doing under a few thousand orders a month. If you don't qualify, skip GA4 predictions and lean on Shopify and Klaviyo.
How much data do you need for predictive analytics?
You need enough completed outcomes for the model to learn from: at least 100 sales for Shopify's predicted spend tier, 500 paying customers and 180 days of history for Klaviyo, and 1,000 buyers plus 1,000 non-buyers in a week for GA4. Below those lines, the tools either hide the prediction or the prediction is noise.
Three things matter more than raw volume:
- Repeat buyers. Klaviyo asks for "some customers who have placed 3 or more orders" because a model can't learn reorder timing from people who only ordered once. A store where 90% of customers buy once has thin training data no matter how big it is.
- Clean order data. Test orders, staff orders, $0 orders and refunds distort every model. Klaviyo excludes cancelled, refunded and zero-value orders from its count for this reason.
- Recent data. Klaviyo requires orders in the last 30 days. A seasonal store that goes quiet for three months will see predictions drop out.
How to start with predictive analytics on Shopify: a 30-day plan
Start with the prediction you can act on fastest, which for most brands is next order timing or high-value segments. The plan below assumes Shopify and Klaviyo, the most common stack.
- Week 1: check eligibility. Open the Shopify segment editor and look for the predicted spend tier filter. Open any Klaviyo profile and check whether the Predictive analytics section shows values or a "does not qualify" message.
- Week 1: clean the data. Tag and exclude test, staff and wholesale orders. Confirm refunds sync back.
- Week 2: build three segments. High predicted spend tier, customers within 7 days of their expected next order date, and customers with high churn risk.
- Week 2: wire one flow per segment. A full-price "new arrivals" message for high-value customers, a reorder reminder timed to the predicted date, and a win-back for churn risks. Keep discounts for the churn group only.
- Week 3: add a holdout. Leave 10% to 20% of each segment out of the flow. Without a holdout, you can't tell whether the prediction drove revenue or just pointed at people who would have bought anyway.
- Week 4: read the result and expand. Compare revenue per recipient against the holdout. Extend the winning segments to SMS and app push.
{{cta2}}
Where does predictive analytics go wrong?
Predictive analytics goes wrong when brands trust the score more than the test. The common failures are small or dirty data, acting without a holdout, and using predictions to hand out discounts to people who would have paid full price.
- Over-discounting predicted buyers. If someone is 80% likely to buy this week, a 20% code mostly gives away margin. Save offers for the churn-risk group.
- Treating a black box as truth. Scores are probabilities. A customer marked "low tier" can still become your best buyer; segments should get refreshed, not frozen.
- Predicting without a channel. A churn score that sits in a dashboard is just a sadder dashboard. Pick the channel before you pick the model.
- Ignoring privacy expectations. Personalization works when it feels helpful. McKinsey found 71% of consumers expect personalized interactions and 76% get frustrated when they don't get them (McKinsey, 2021). Creepy targeting erodes the same trust.
This is where your owned channels decide the outcome. A Shopify mobile app gives predictions a direct line to the customer: push notifications that reach the lock screen, and a home screen that can change by segment. With Appbrew, you can send push campaigns to segments you build in Klaviyo, and Milo, Appbrew's AI assistant, drafts the campaign from your store data and waits for your yes before anything goes out. Our guide to automating app push with Klaviyo shows the setup.
Frequently asked questions
What is an example of predictive analytics in ecommerce?
A common example is a reorder reminder timed to each customer's predicted next order date. Klaviyo calculates the date from past order intervals, and the brand sends the reminder just before it. Every Man Jack uses this approach and earns 12.4% of its Klaviyo-attributed revenue from predictive segments.
Does Shopify have predictive analytics?
Yes. Shopify's predicted spend tier sorts customers into high, medium and low future-spend tiers inside the customer segmentation tool. Your store needs more than 100 sales to use it, and only customers who have purchased are scored. You can combine the tier with other filters, such as email consent.
What are the types of analytics in ecommerce?
Ecommerce analytics usually splits into four types: descriptive (what happened), diagnostic (why it happened), predictive (what will probably happen) and prescriptive (what to do next). Most Shopify reports are descriptive. Predictive tools like Klaviyo and GA4 add forward-looking scores you can act on.
How can predictive analytics increase ecommerce sales?
Predictive analytics increases sales by changing the timing and targeting of what you already do. Reminders land when customers are ready to reorder, win-back offers go only to likely churners, and stock arrives before bestsellers sell out. McKinsey puts the typical personalization revenue lift at 10% to 15%.
Is predictive analytics worth it for a small Shopify store?
It is worth it once you clear the data minimums. Below about 500 paying customers and 180 days of order history, Klaviyo won't generate predictions, so a small store gets more from clean RFM segments first. Shopify's predicted spend tier works from 100 sales, which makes it the easiest starting point.
Predict less, act sooner
The brands that get value from predictive analytics aren't running the fanciest models. They pick one prediction, tie it to one message in one channel, test it against a holdout and expand what works. Start with next order timing, and book a demo if you want those predictions reaching customers through your own app.
Milo builds your app from your Shopify store and drafts every change, then waits for your yes.