

.webp)




Our 2026 report on customer retention statistics: average rates by industry, churn benchmarks, and first-party data from 250+ Shopify brands.
B2B SaaS companies keep more than 90% of their customers each year. Ecommerce stores keep about 30%. "Good" retention means nothing until you know which end of that range you belong on.
That is what this report is for. Below are the customer retention statistics worth knowing in 2026, from average rates by industry to why customers leave, combining published research with first-party data from Appbrew's network of 250+ Shopify brands.
What is the average customer retention rate?
The average customer retention rate is about 75% across all industries, but it varies sharply by sector. B2B SaaS and enterprise software retain 90 to 95%, insurance and banking 83 to 92%, telecom and media 77 to 85%, retail around 63%, and ecommerce just 30 to 35%. A good retention rate is one above your industry's benchmark, not a fixed number.
Quick Insights: Key customer retention statistics for 2026
The numbers worth knowing before you benchmark your own:
- The average all-industry retention rate is about 75%, but the real range runs from 90%+ in B2B SaaS to 30–35% in ecommerce.
- A 5% increase in retention can raise profits by 25% to 95% .
- Acquiring a new customer costs five to 25 times more than retaining an existing one.
- Existing customers convert at 60 to 70%, compared to just 5 to 20% for new prospects.
- 68% of customers leave because they feel a company is indifferent to them.
- Amazon Prime retains roughly 93% of members after year one and 98% after year two, the benchmark for subscription retention.
- The average ecommerce store loses about 72% of its customers within a year of their first purchase.
Customer retention rate by industry (2026)
Retention rate means little without an industry to compare against. A 35% rate would be a crisis for a bank and a strong result for a fashion store. This section breaks down the benchmarks by industry, by business model, and by what actually drives the differences.
- The single biggest predictor of retention is not effort or budget. It is the switching cost: how hard it is for a customer to leave.
- Business models matter more than industry labels. A subscription brand and a one-time-purchase brand in the same category can differ by 50 points.
Average retention rate by industry
|
Industry |
Average retention rate (annual) |
|
Media & entertainment |
84% |
|
Professional services |
84% |
|
Automotive & transportation |
83% |
|
Insurance |
83% |
|
IT services |
81% |
|
Telecommunications |
78% |
|
Financial services |
78% |
|
Healthcare |
77% |
|
B2B SaaS / software |
90% |
|
Banking |
75% |
|
Consumer services |
67% |
|
Manufacturing |
67% |
|
Retail |
63% |
|
Hospitality & travel |
55% |
|
Ecommerce |
30% |
Source: Statista, CustomerGauge, and Shopify industry benchmarks, 2026.
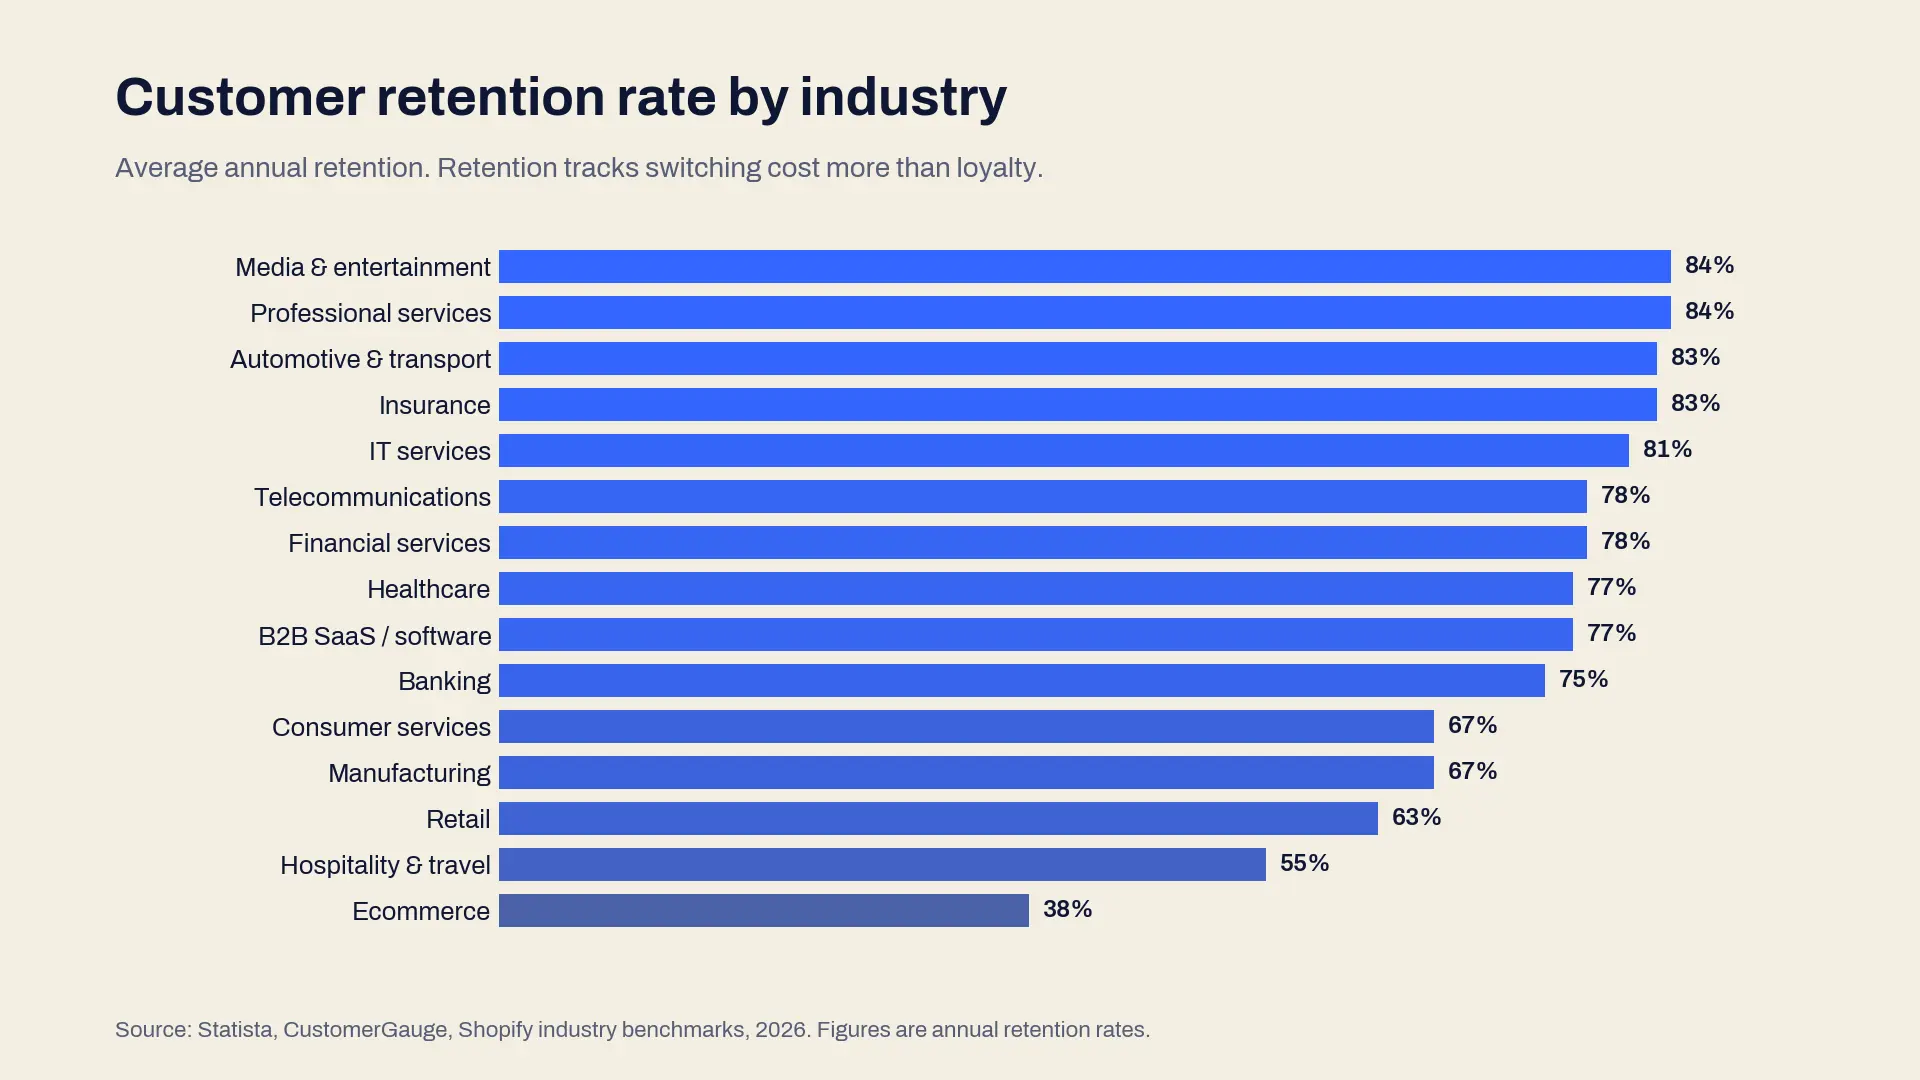
The order tells the story. Industries at the top sell contracts, policies, and services that are disruptive to switch away from. Industries at the bottom sell discretionary, one-off purchases in markets where a competitor is one click away. Retention tracks lock-in more than it tracks loyalty.
Retention rate by business model
The same product can retain very differently depending on how it is sold. Business models are often a sharper predictor than industry.
|
Business model |
Retention rate (annual) |
Median customer lifetime |
|
Subscription (B2B SaaS) |
90% |
~5 years |
|
Contractual services |
86% |
~4 years |
|
Membership models |
81% |
~3.5 years |
|
Subscription (B2C) |
72% |
~2.8 years |
|
Transactional (ecommerce) |
30% |
~18 months |
|
One-time purchase |
24% |
~11 months |
Source: ProfitWell/Paddle, Recurly, and Statista, 2026.
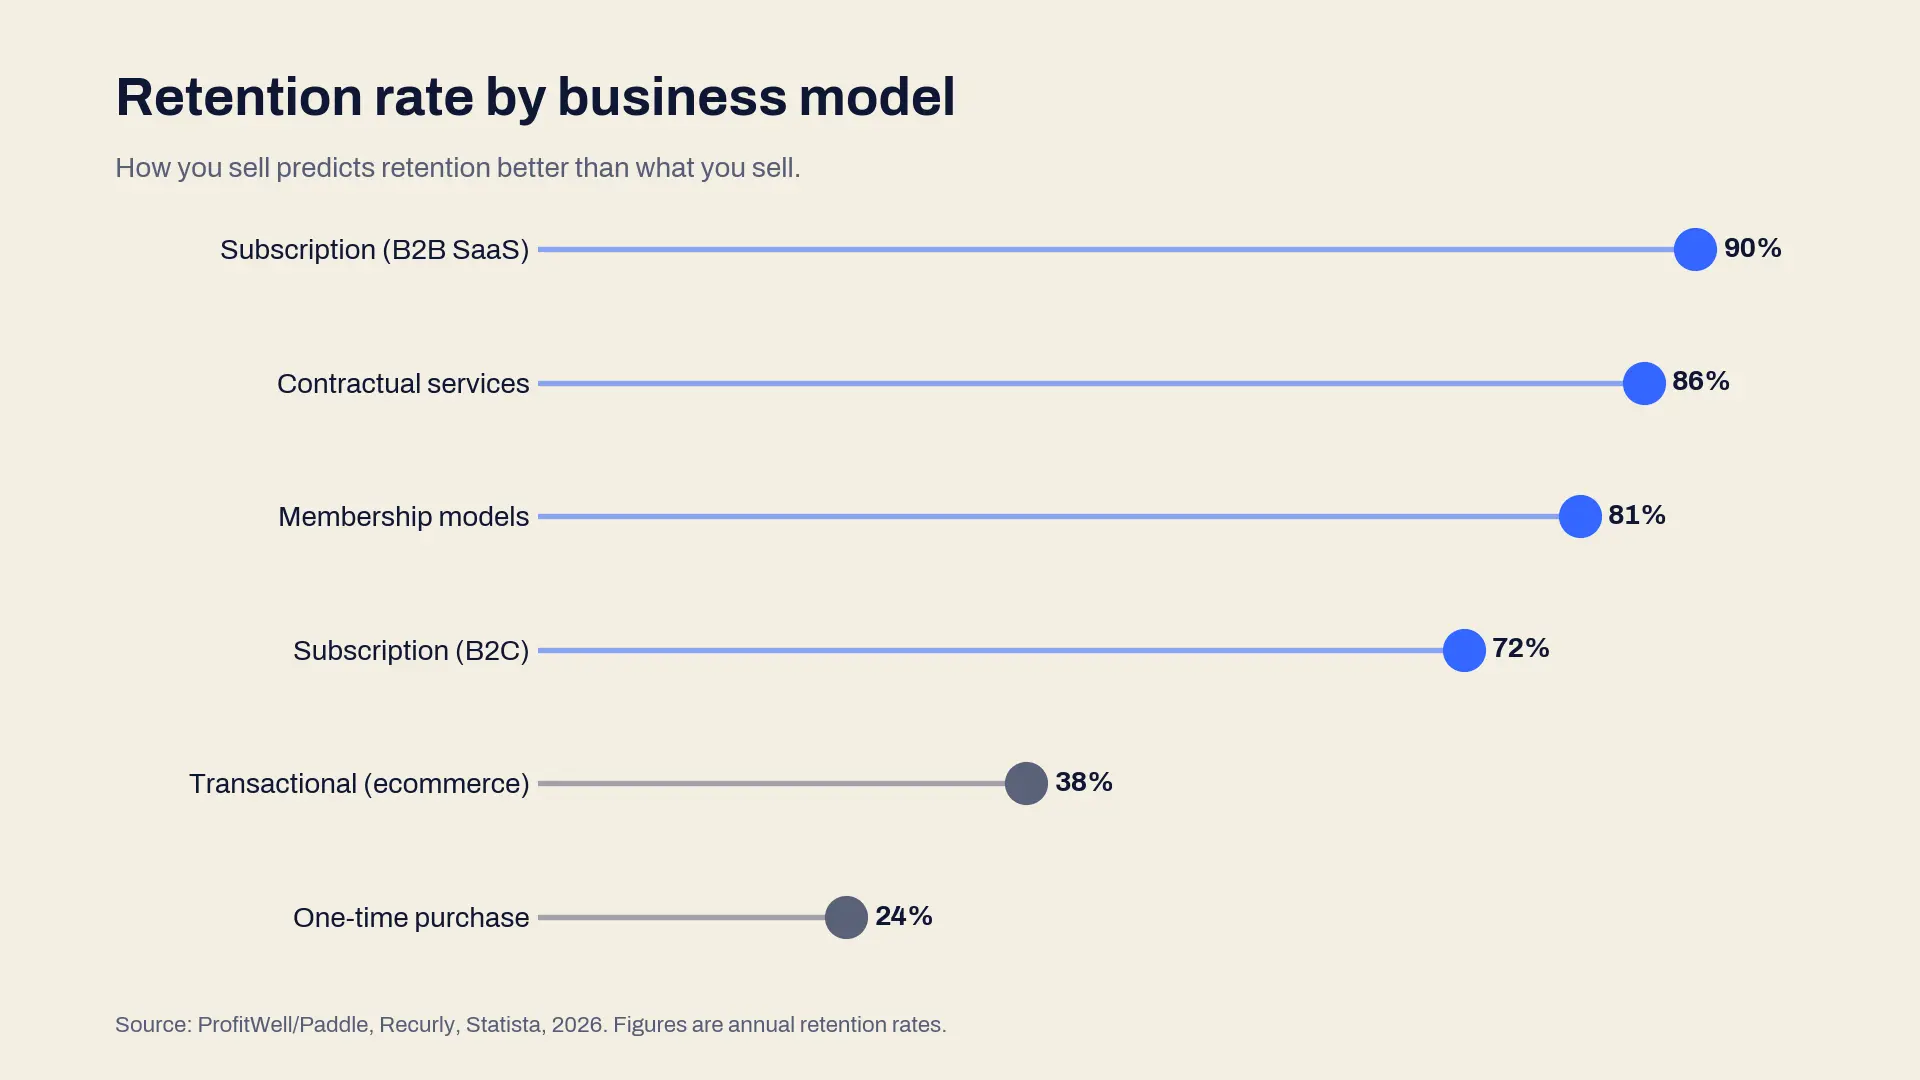
The gap between B2B and B2C subscriptions is the revealing one. Business buyers retain far better than consumers, because leaving involves multiple stakeholders, integration work, and organizational disruption. A consumer just stops clicking.
Why high-churn industries struggle
The industries at the bottom of the table share structural problems that no amount of marketing fully fixes.
|
Industry |
Retention (annual) |
Primary churn driver |
Secondary factor |
|
Ecommerce |
30-40% |
Price sensitivity & competition |
Low differentiation |
|
Hospitality |
55% |
Experience variability |
High expectations |
|
Retail |
63% |
Convenience competition |
Promotional dependency |
|
Consumer services |
67% |
Discretionary spending |
Ease of switching |
Source: CustomerGauge, DemandSage, 2026.
The common thread is low switching cost. When leaving is easy and alternatives are plentiful, retention has to be earned on every single purchase rather than locked in by a contract.
Why retention benchmarks disagree
Compare a few of these reports side by side and the numbers rarely match. B2B SaaS shows up anywhere from 77% to 95%; insurance from 83% to 92%. That is not carelessness, it is measurement. Three things move the number:
- Logo vs revenue retention. Keeping 90% of your customers but losing your biggest account is very different from keeping 90% of revenue. Reports often quote whichever is more flattering.
- The time window. A 30-day, 90-day, and 365-day retention rate for the same business looks completely different. Always check the period before comparing.
- What counts as churned. Subscription businesses know the exact moment a customer leaves. Ecommerce has to define it, since a shopper who has not bought in 90 days may simply not need anything yet.
So do not chase a universal figure. Measure your own rate consistently, then benchmark it against your category and business model rather than the economy at large.
The Appbrew 2026 Retention Report: ecommerce data from 250+ Shopify brands
These numbers come straight from Appbrew's platform, measured across live purchase behavior on 250+ Shopify brands.
Methodology: figures are drawn from first-party order data across 250+ Shopify brands over a trailing 12-month window. Rates are reported as the median across brands, so a single very large or very small store does not skew the benchmark.
The median ecommerce brand has a 21.7% repeat purchase rate, roughly one in five customers returns within a year. On the mobile app specifically, the median rises to 23.0%. But the spread by category is enormous:
|
Category |
Median repeat rate (12-month) |
|
Pet care & supplies |
40.5% |
|
Health, wellness & supplements |
29.8% |
|
Food & beverage |
25.2% |
|
Beauty & personal care |
24.3% |
|
Fashion & apparel |
22.7% |
|
Kids & baby |
20.1% |
|
Home & living |
19.4% |
|
Jewelry & accessories |
18.5% |
|
Lifestyle & gifting |
18.5% |
|
Plants & gardening |
16.6% |
|
Footwear |
12.2% |
|
Mattresses & large durables |
4.9% |
Source: Appbrew first-party data across 250+ Shopify brands, trailing 12-month window.
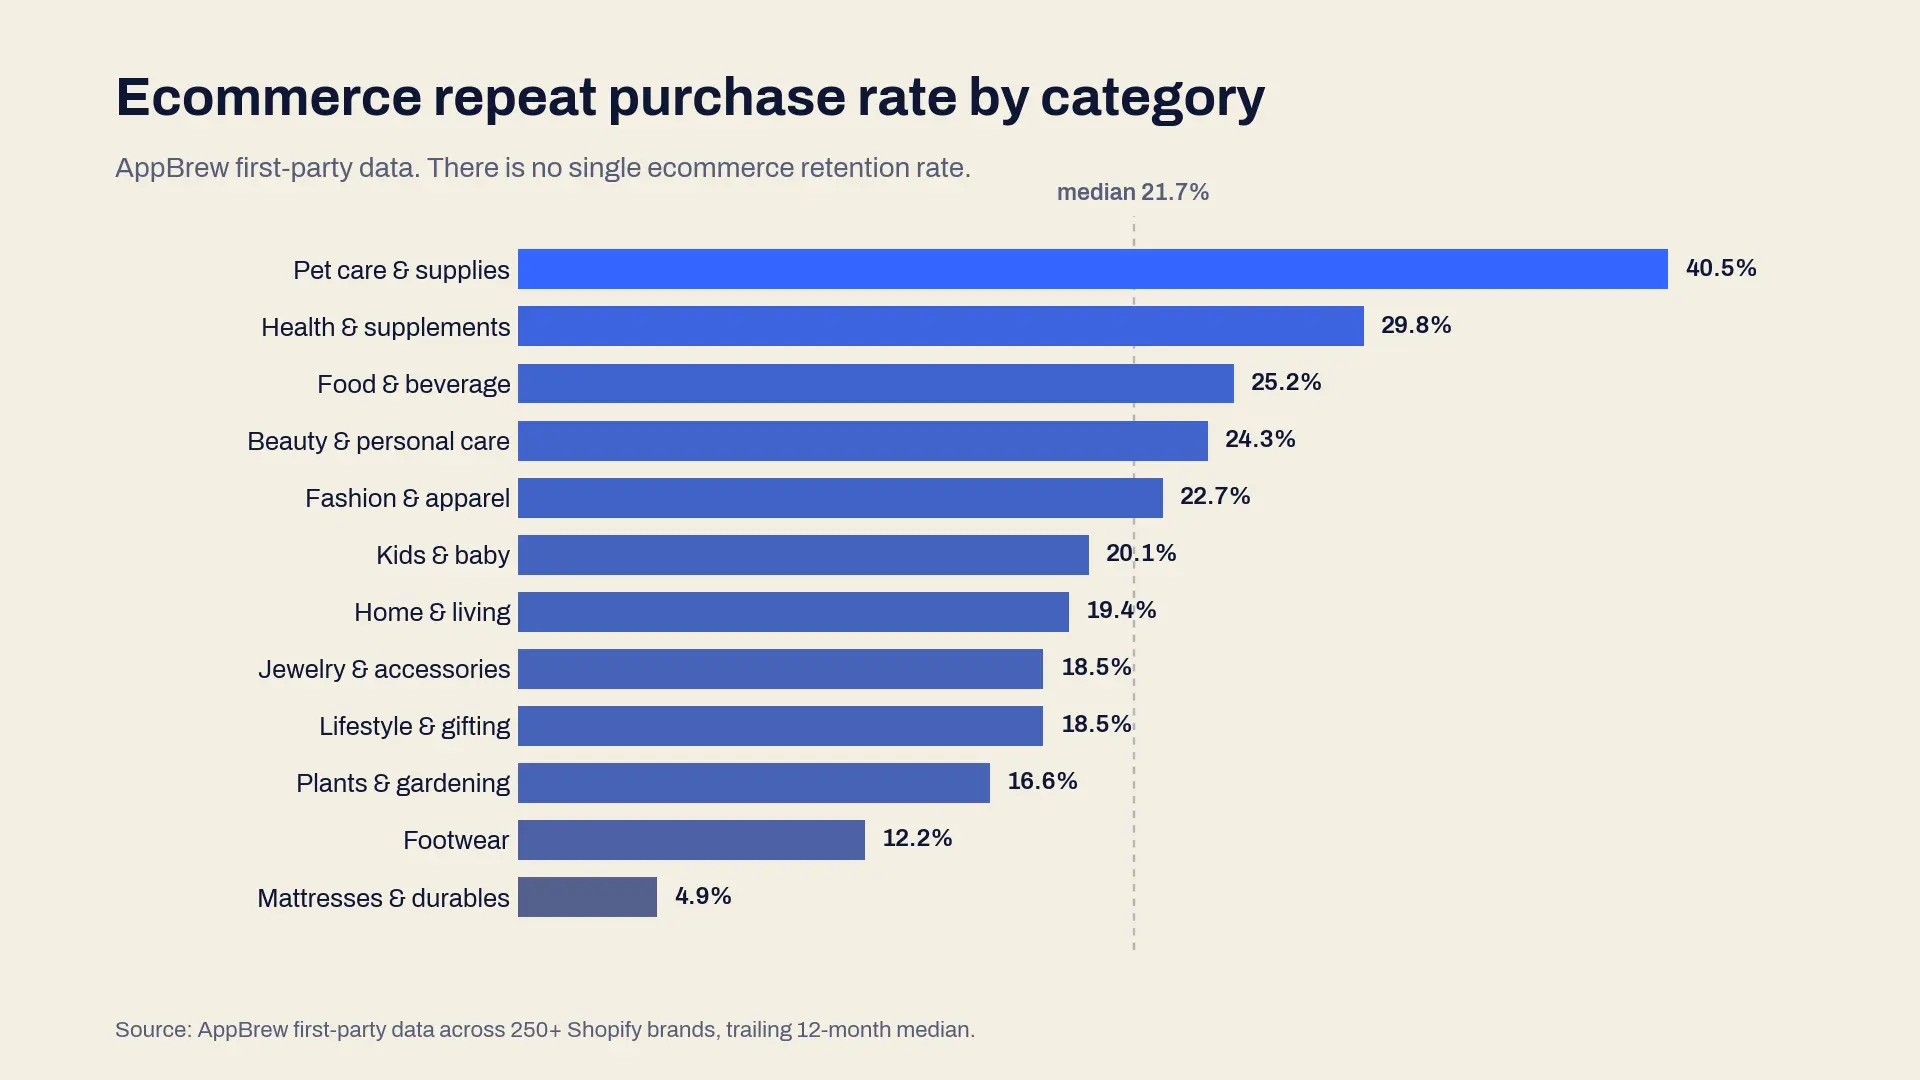
For a deeper breakdown of ecommerce retention by product category and the strategies that improve it, see our guide to ecommerce customer retention.
{{cta}}
Customer churn statistics 2026
Churn is retention viewed from the other side. If your retention rate is 70%, your churn rate is 30%. Watching both matters, because retention tells you how many customers you kept while churn tells you how fast you are losing them and why.
Churn benchmarks
|
Metric |
Figure |
Basis |
|
Average ecommerce churn rate |
62–70% |
Annual |
|
Average SaaS customer churn |
5–7% |
Annual |
|
Average SaaS revenue churn |
3–5% |
Annual |
|
"Good" subscription churn |
under 5% |
Monthly |
|
Ecommerce customers who never make a second purchase |
~72% |
Within 12 months |
Source: Recurly, ProfitWell/Paddle and industry benchmarks, 2026.
The ecommerce and SaaS numbers look like different universes because they are. A SaaS customer has to actively cancel; an ecommerce customer churns simply by not coming back, which is why ecommerce churn runs so much higher.
Why customers/clients leave
Most churn is not about price, even though price is what customers say when asked directly. The larger drivers are about how the customer was treated.
- 68% of customers leave because they believe a company is indifferent to them (Rockefeller Corporation). This is the single most-cited reason and the most preventable.
- Around 73% of customers will switch after more than one poor service experience.
- Only about 1 in 26 unhappy customers complains. The rest just leave, which means visible complaints are the small tip of a much larger churn problem.
- Actively disengaged customers, the ones who quietly stop opening emails and logging in, churn at far higher rates than those who ever voice a problem.
Source: Esteban Kolsky customer-experience research.
The customers who churn loudly are rare. Most leave in silence, which is why early behavioral signals (declining visits, unopened messages, a missed reorder) matter more than complaint volume for predicting churn.
Retention vs acquisition stats 2026
The reason retention gets so much attention in boardrooms comes down to economics. Keeping a customer is cheaper, more profitable, and more predictable than winning a new one. The stats behind that claim:
|
Statistic |
Figure |
Basis |
|
Cost to acquire vs retain a customer |
5–25x more expensive to acquire |
Per-customer cost |
|
Profit lift from a 5% retention increase |
25–95% |
Profit, not revenue |
|
Conversion rate, existing customers |
60–70% |
Probability of sale |
|
Conversion rate, new prospects |
5–20% |
Probability of sale |
|
Existing customers spend |
~31% more than new customers |
Average spend |
Sources: Harvard Business Review,Reichheld & Sasser, Bain & Company, Marketing Metrics, Invesp.
The first order tends to just cover the cost of acquisition, and the profit shows up in the orders that follow. A returning customer costs almost nothing to reach through channels you already own, converts far more readily, and spends more as trust builds. That is why a small improvement in retention moves the bottom line more than the same effort poured into new traffic.
Acquisition is also getting harder, which sharpens the case. Ad platforms are more crowded and privacy changes have made targeting less precise, so the cost of a new customer has climbed across most categories. As acquisition gets more expensive, the relative value of every retained customer rises with it.
Customer loyalty program statistics 2026
Loyalty programs are close to universal in ecommerce and retail, but most of the value they promise never gets realized. The data tells two stories at once: programs work, and most are badly underused.
|
Statistic |
Figure |
Basis |
|
Consumers belonging to at least one loyalty program |
~90% of shoppers |
US consumers |
|
Average number of programs a consumer joins |
16–18 |
Per person |
|
Programs a consumer actively uses |
~7–8 |
Per person |
|
Members who forget or fail to redeem rewards |
~40% |
Of members |
|
Loyalty program members spend |
12–18% more per year |
Vs non-members |
Sources: Bond Brand Loyalty, McKinsey, Deloitte loyalty research.
Some standout program results show what happens when loyalty is done well:
- Starbucks Rewards accounts for a majority of the chain's US transactions, one of the most cited examples of a loyalty program driving core revenue.
- Amazon Prime members spend multiples of what non-members spend, with renewal rates above 90%.
- Paid membership programs in general tend to outperform free ones, because the upfront commitment selects for customers who intend to keep buying.
The lesson across all of them: a loyalty program is only as valuable as the share of members who actually engage with it. Enrollment is a vanity metric; redemption and repeat behavior are the ones that move retention.
Companies with the highest customer retention rates in 2026
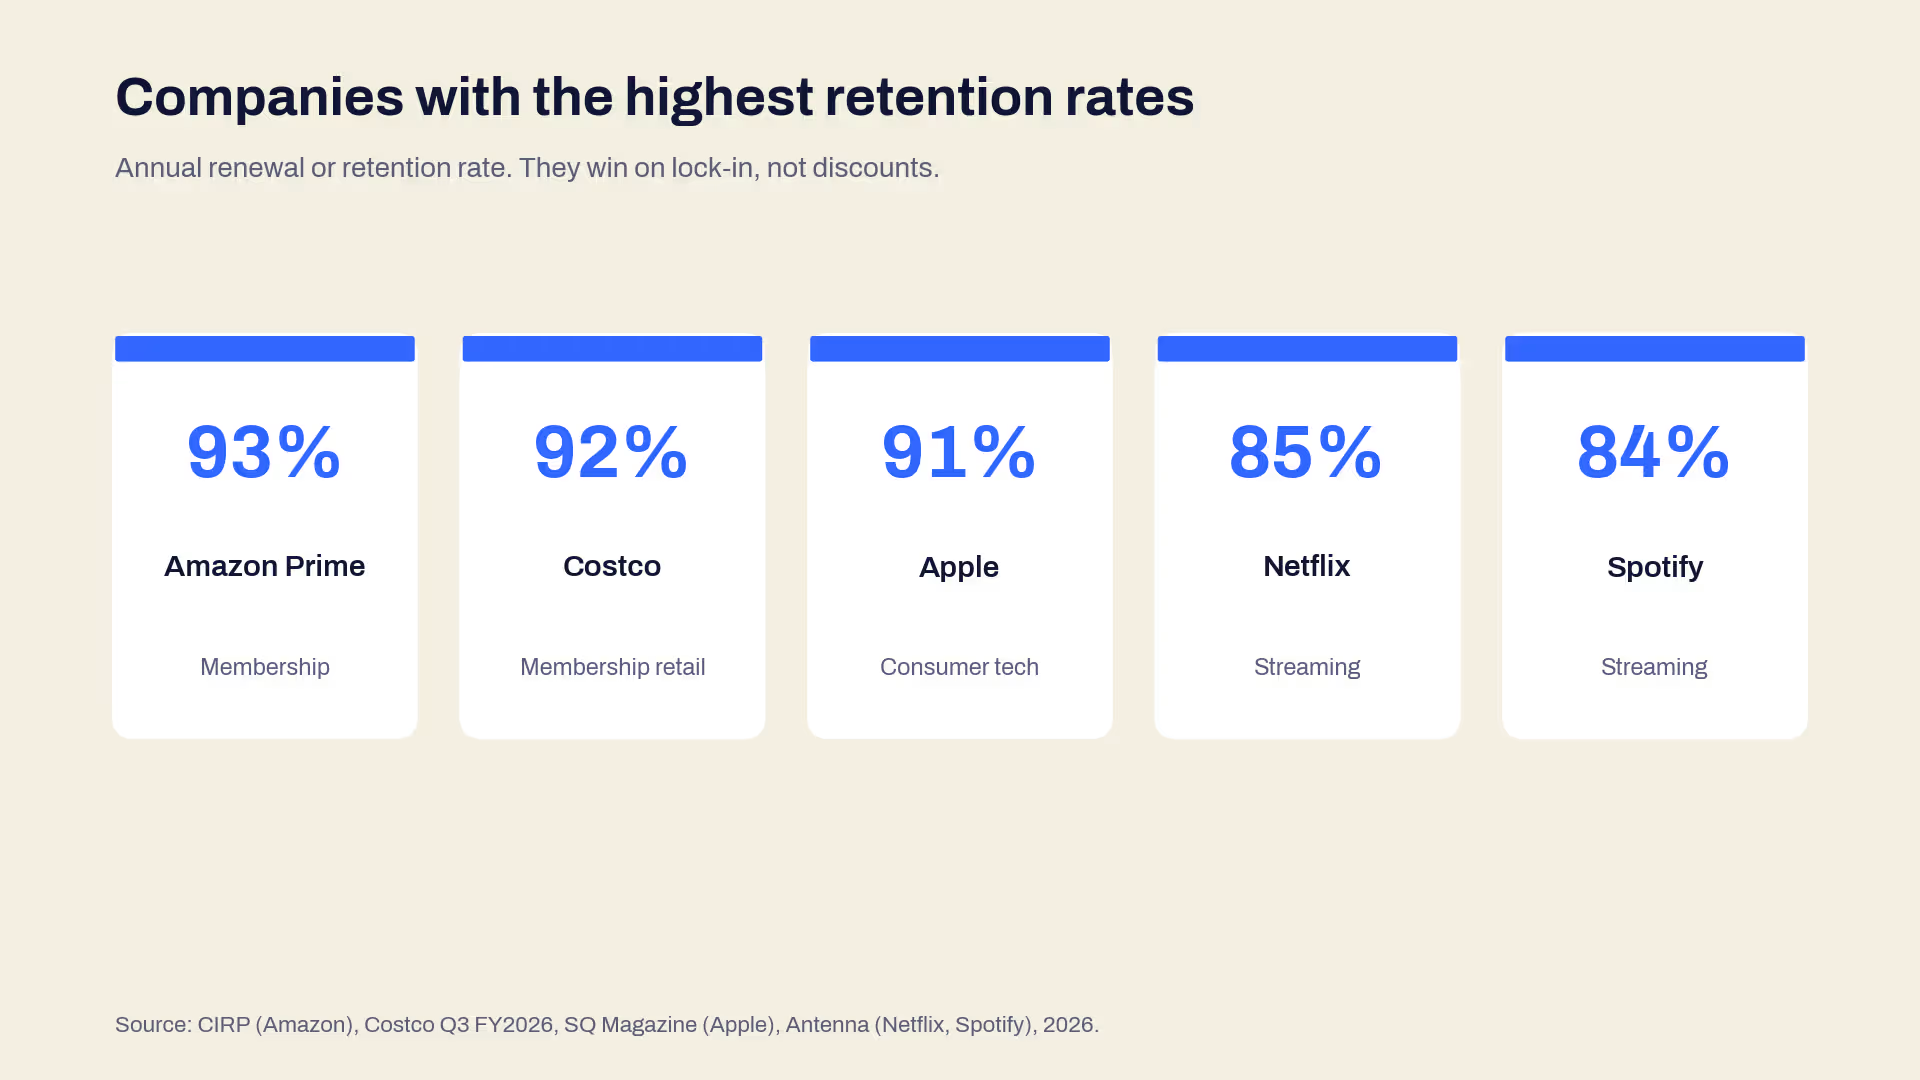
The brands famous for retention share one trait: they make leaving feel like a loss. Whether through a membership fee, an ecosystem, or sheer convenience, they raise the cost of switching until staying is the easy choice. A few benchmarks across categories:
|
Company |
Category |
Retention / renewal rate |
Basis |
|
Amazon Prime |
Membership / marketplace |
~93% year one, ~98% after year two |
Annual member renewal |
|
Apple (iPhone) |
Consumer electronics |
~90–92% |
Annual repurchase / ecosystem loyalty |
|
Costco |
Membership retail |
92.2% (US & Canada), 89.7% (worldwide) |
Annual membership renewal |
|
Netflix |
Streaming |
~85%+ (churn ~2% monthly) |
Annual retention |
|
Spotify Premium |
Streaming / audio |
~84% |
Annual retention |
|
Sephora (Beauty Insider) |
Beauty retail |
34M+ members driving majority of sales |
Loyalty-program share |
|
HubSpot |
B2B SaaS |
~103% net revenue retention |
Annual net revenue retention |
Sources: CIRP (Amazon Prime); SQ Magazine (Apple); Costco Q3 FY2026 results; Antenna (Netflix, Spotify); HubSpot 2025 annual report. Figures current as of 2026.
HubSpot's 103% "net revenue retention" means existing customers spent more this year than last, even after accounting for those who left. That is the gold standard: a customer base that grows in value without a single new signup.
None of these companies retain through discounts. They retain through membership mechanics, ecosystem lock-in, and a consistently good reason to come back. That is the difference between buying repeat purchases and earning them.
Customer retention trends and 2026-27 forecast
Retention fundamentals do not change: people return to brands that treat them well and make buying easy. What is shifting is how brands earn that return, and three trends stand out for 2026-27.
Prediction is replacing reaction.
Retention work has traditionally been reactive, chasing customers after they go quiet. The move now is to catch churn signals before a customer disappears, using behavioral data to flag risk early. For how that plays out in practice, see our guide to AI shopping assistants and ecommerce personalization trends.
Owned channels are becoming the retention moat.
As ad costs climb and AI search reshapes discovery, a direct line to existing customers is one of the few things a brand fully controls. This is why retention budgets are shifting toward ecommerce apps, push, and logged-in experiences, where reaching a customer again costs almost nothing. Our breakdown of push notifications vs SMS has the channel-level economics.
Measurement is getting honest.
As retention spend grows, so does the scrutiny. Expect more teams to move from attributed revenue to incremental lift, and to track net revenue retention rather than a single headline number, so retention programs get credited only for purchases that would not have happened anyway.
The forecast: the retention gap between categories will widen, not shrink. Subscription and membership models are getting better at lock-in through AI and owned channels, while transactional, low-differentiation categories stay under pressure as switching costs remain near zero and acquisition keeps getting pricier.
The brands that pull ahead in the hard categories will be the ones that treat retention as infrastructure, built into the product and the channels they own, rather than as a recurring campaign.
{{cta2}}
FAQs
What is the average customer retention rate?
The average customer retention rate is about 75% across all industries, but it varies sharply by sector. B2B SaaS retains 90 to 95%, insurance and banking 83 to 92%, telecom and media 77 to 85%, retail around 63%, and ecommerce 30 to 38%, depending on whether you measure retention rate or repeat-purchase rate. Always benchmark against your own industry rather than the overall average.
What is a good customer retention rate by industry?
A good retention rate is one above your industry's benchmark. For subscription and B2B SaaS, that means 90% or higher. For retail, the low-to-mid 60s is solid. For ecommerce, anything above 35% is strong, since the category average sits near 30%. Business model matters as much as industry: subscription models retain far better than one-time-purchase ones.
What does an 80% customer retention rate mean?
An 80% retention rate means you kept 80 of every 100 existing customers over the measured period, losing 20% to churn. That figure is excellent for ecommerce, typical for many subscription businesses, and below par for enterprise B2B SaaS. Always check the time window and business model before comparing.
What percentage of customers make a repeat purchase?
It depends heavily on category. Across ecommerce brands, the median repeat purchase rate is about 22%, ranging from roughly 40% in pet care to under 5% for one-time durables like mattresses. Consumables retain far better than high-consideration, infrequent purchases.
Which companies have the highest customer retention rates?
Amazon Prime (around 93% year-one renewal), Costco (92% membership renewal), Apple (roughly 90% iPhone loyalty), and Netflix (around 85%) are among the highest. They share high switching costs, ecosystem lock-in, or membership mechanics rather than relying on discounts.
Is customer retention cheaper than acquisition?
Yes. Acquiring a new customer is widely estimated to cost five to 25 times more than retaining an existing one, and existing customers convert at 60 to 70% versus 5 to 20% for new prospects. Treat the exact multiples as directional, but the gap is real and widening as ad costs rise.