

.webp)
.webp)


See what a good mobile app retention rate looks like for online stores, the Day-1/7/30 benchmarks by category, and the strategies that boost repeat buyers.
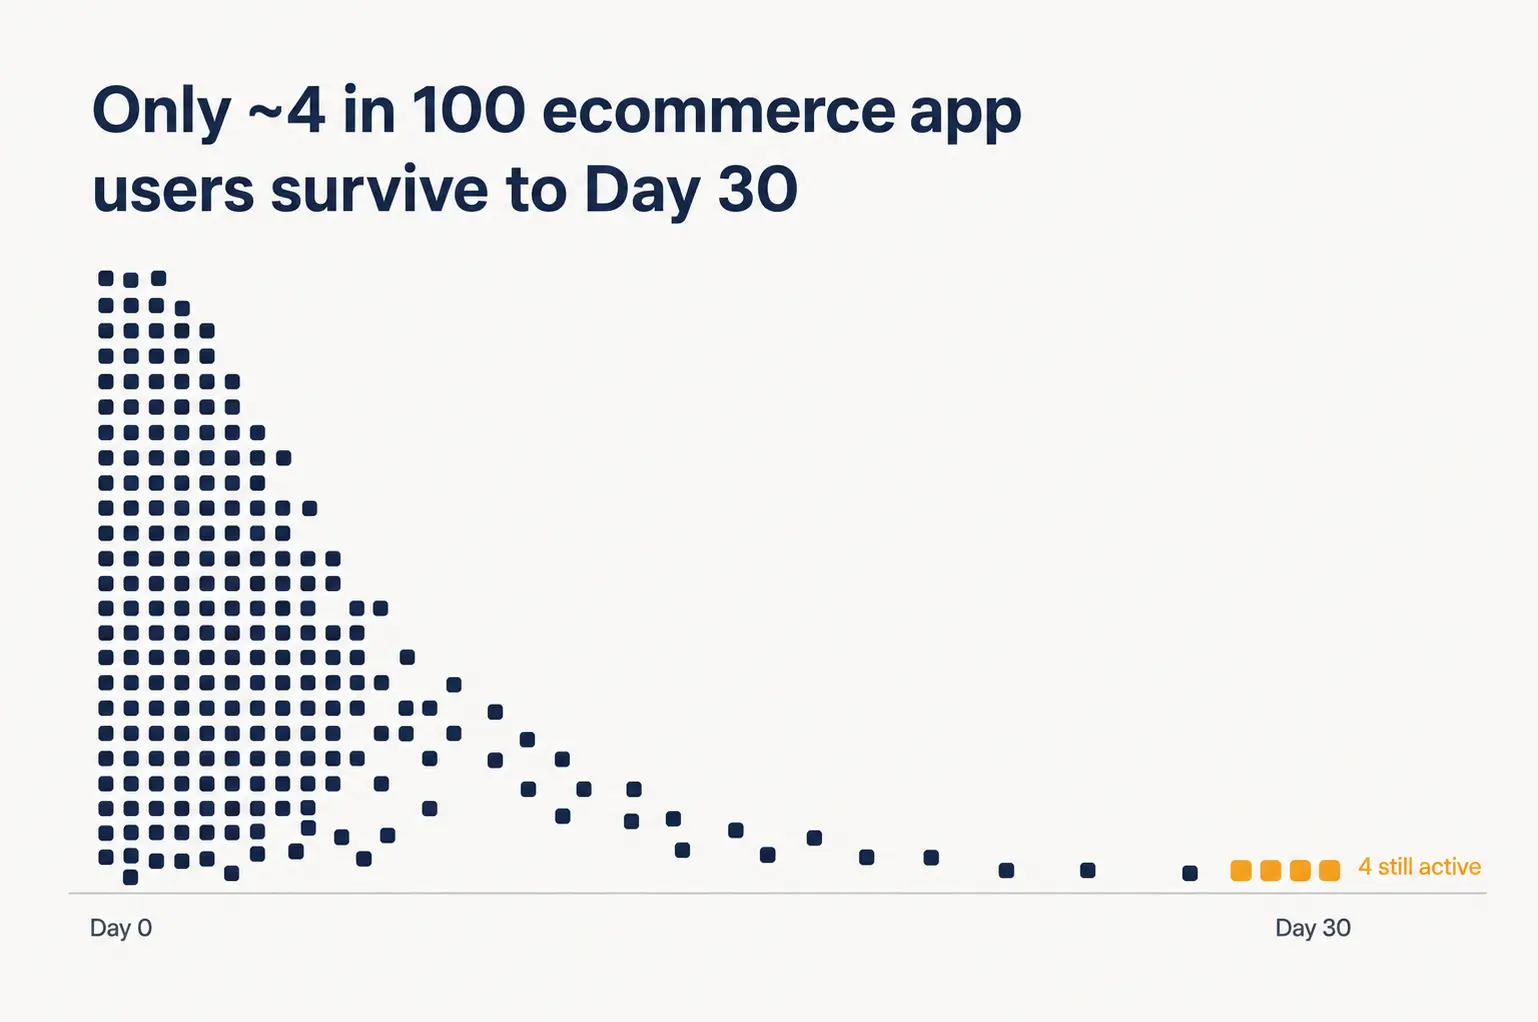
For every 100 people who install an ecommerce app, only around three to six are likely to remain active 30 days later.
That is the uncomfortable baseline for mobile app retention in 2026. Getting downloaded is only the first hurdle. Your app must then compete for attention with Amazon, Instagram, Netflix, and the handful of other apps your customer already opens without thinking.
Some brands have earned that habit. Starbucks gives customers rewards and order-ahead convenience. Nike brings members back for exclusive products and early access. Sephora keeps loyalty progress, personalized recommendations, and rewards inside the app. You may not have their scale, but you can apply many of the same retention principles to give customers a reason to keep coming back.
That is exactly what this guide will help you do. You will learn what a good mobile app retention rate looks like for an online store in 2026, the benchmarks by day and by category, and the strategies the highest-retention brands use to beat them.
TL;DR
- Average mobile app retention lands near 25% on Day 1, 8% on Day 7, and 4% on Day 30 across industries. For ecommerce apps, Day-30 sits around 3% to 6%.
- Mobile app retention measures how many users return after installing an app. It is different from repeat purchase rate, which tracks how many customers buy again.
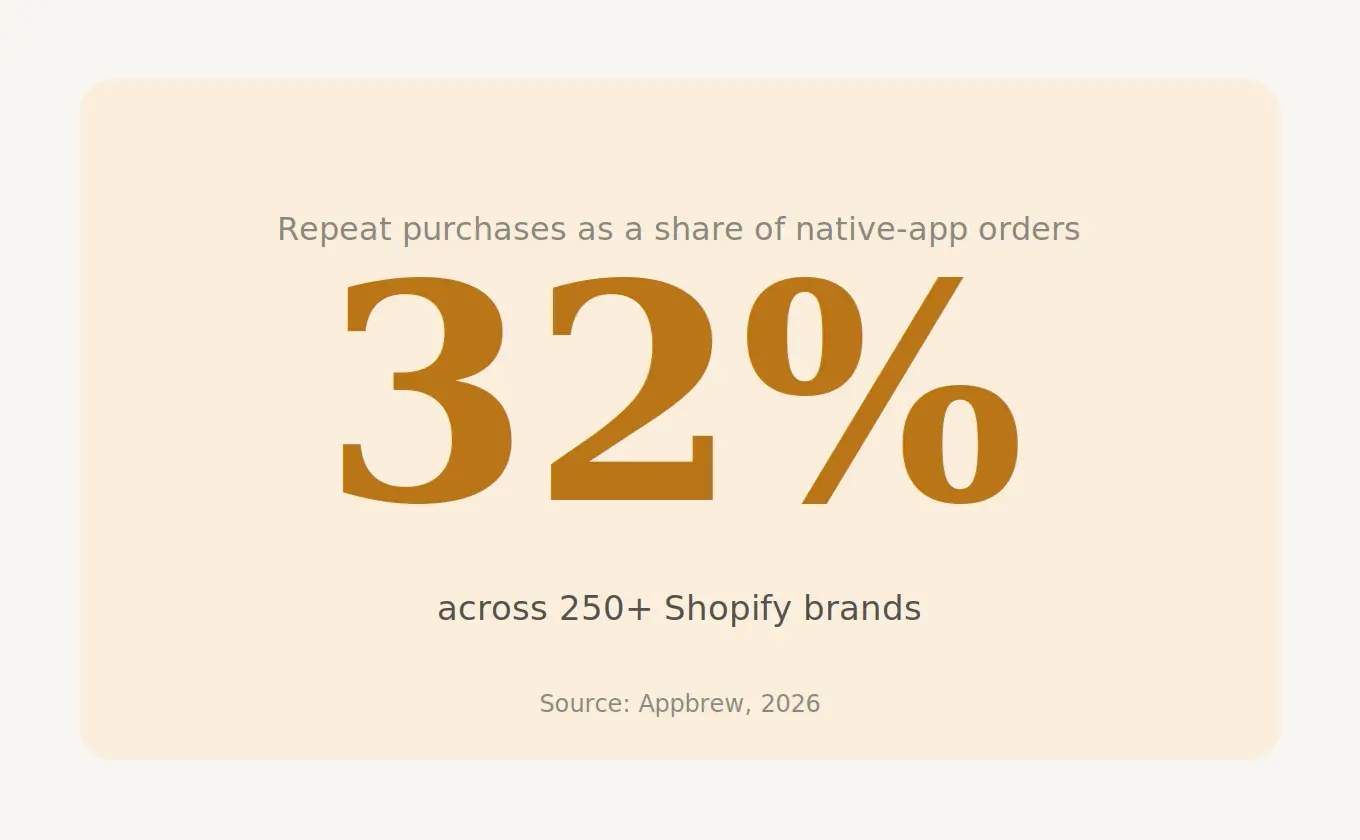
- App shoppers repeat far more than web shoppers. Across 250+ ecommerce brands, repeat purchases made up 32% of native-app orders.
- To increase app retention: get users to value in the first session, run push on behavior instead of blasts, surface loyalty inside the app, add subscriptions, and reduce post-purchase uncertainty.
- You do not need Amazon-sized traffic to improve retention. You need to find where users drop off, fix the first-session experience, and build repeatable reasons for them to return.
What is mobile app retention?
Mobile app retention is the percentage of users who return to an app after installing it. It is usually measured at fixed checkpoints such as Day 1, Day 7, and Day 30. A higher retention rate means more users continue finding enough value in the app to reopen it.
For an online store, retention answers a simple question: Did the customer come back after downloading the app?
Each checkpoint reveals something different:
- Day 1 retention shows whether the first session gave users enough value to return.
- Day 7 retention indicates whether the app has started earning a place in their shopping routine.
- Day 30 retention shows whether the app provides a lasting reason to stay installed.
Mobile app retention vs churn vs repeat purchase
These metrics are related, but they do not measure the same behavior.
|
Metric |
What it measures |
|
App retention |
The percentage of users who return to the app after a defined period. |
|
App churn |
The percentage of users who stop returning during that period.If Day-30 retention is 4%, Day-30 churn is 96%. They always add up to 100%. |
|
Repeat purchase rate |
The percentage of customers who place another order. |
A customer can go 30 days without opening an apparel app and return on Day 45 to buy from a new collection. That user may appear churned in a Day-30 retention report but retained in commercial terms.
Online stores should therefore track both app usage retention and repeat purchases. Retention inside the app is one piece of a bigger picture. Our guide to ecommerce customer retention strategies covers the channel-agnostic tactics that keep customers buying across web, email, and app.
What is a good mobile app retention rate?
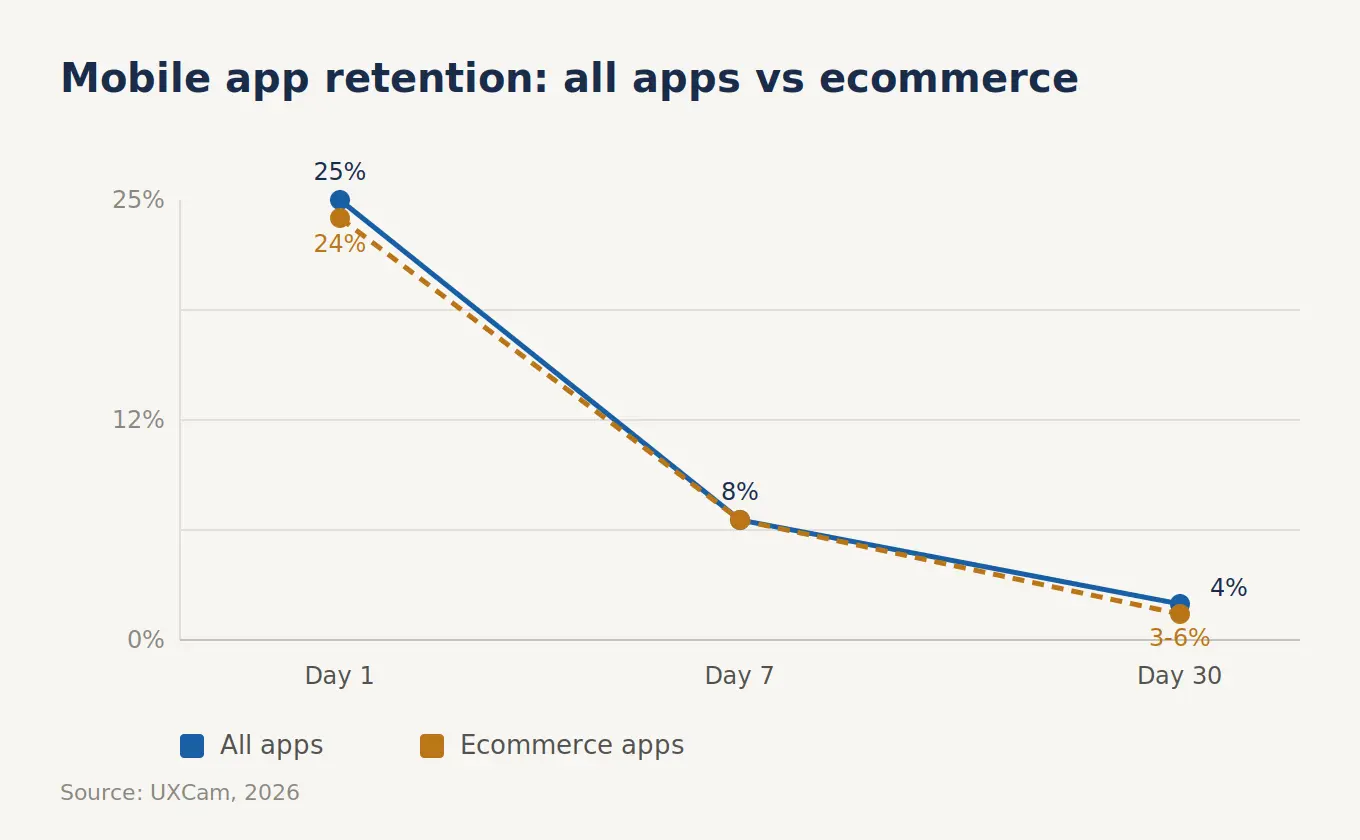
For most online stores, a good Day-30 mobile app retention rate is anything above 6%. The cross-industry median sits at roughly 25% on Day 1, 8% on Day 7, and 4% on Day 30.
The average mobile app retention rate in ecommerce runs roughly 3% to 6% by Day 30, with about 22% to 26% of users returning on Day 1.
Ecommerce app retention benchmarks by day
Retention falls fastest during the first week.
|
Timeframe |
All apps (median) |
Ecommerce apps |
|
Day 1 |
~25% |
22–26% |
|
Day 7 |
~8% |
6–10% |
|
Day 30 |
~4% |
3–6% |
Source: (UXCam, 2026)
App retention benchmarks by category
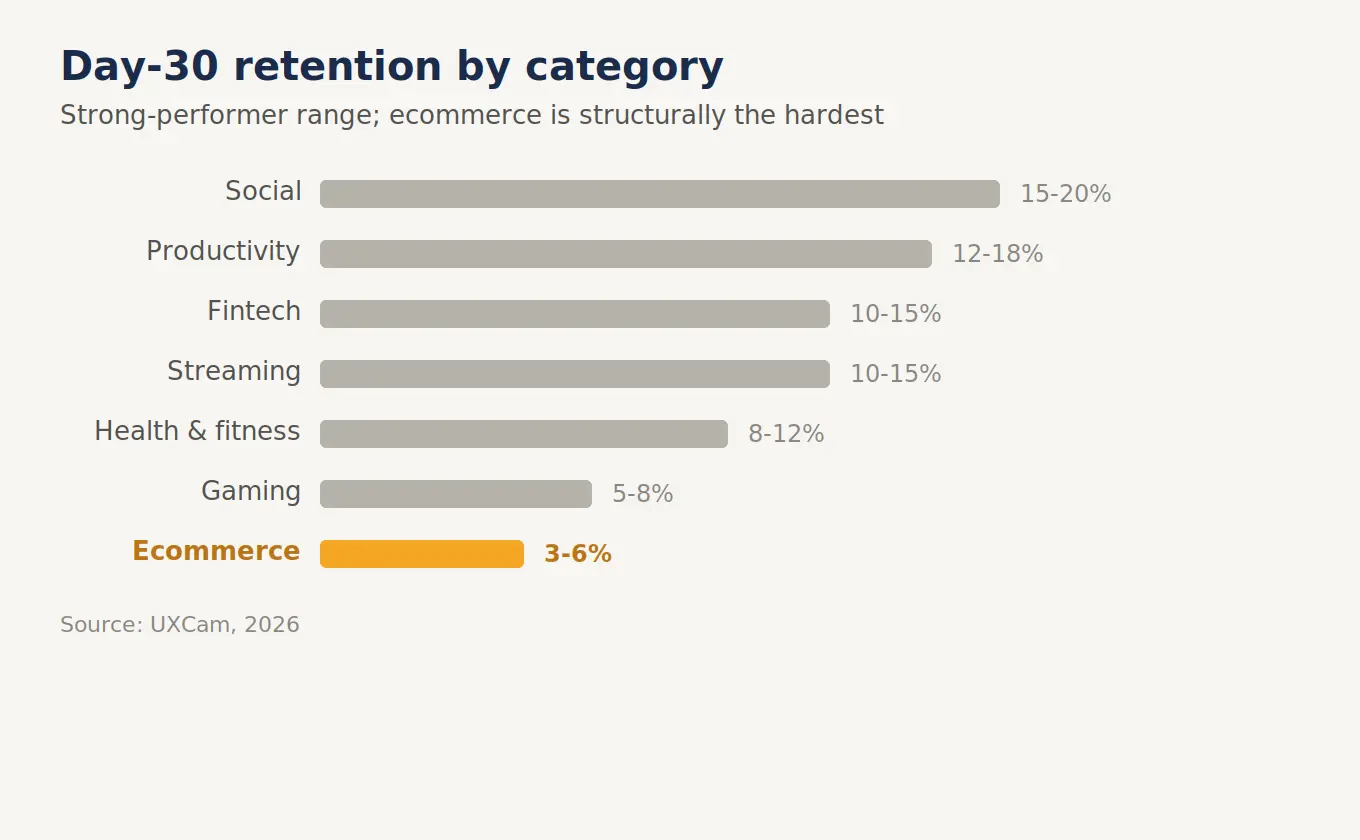
Retention also varies sharply by what the app is for. People open social and messaging apps daily, so those retain far higher. Shoppers don't buy every day, so ecommerce retention looks lower by nature, and that's normal.
These app retention benchmarks show how different apps average for D-30 user retention.
|
App category |
Median Day-30 retention |
Strong performer |
|
Social |
12% |
15%–20% |
|
Productivity |
8% |
12%–18% |
|
Fintech |
7% |
10%–15% |
|
Streaming and media |
7% |
10%–15% |
|
Health and fitness |
5% |
8%–12% |
|
Gaming |
3% |
5%–8% |
|
Ecommerce |
2% |
3%–6% |
Source: UXCam, Mobile App Retention Benchmarks by Industry, 2026
For how these retention rates translate into repeat-purchase behavior by category, see our customer retention statistics report. Two apps at the same 5% Day-30 retention can be in completely different health.
The 6 most effective mobile app retention strategies for online stores in 2026
The most effective mobile app retention strategies for online stores are:
- Get users to value fast in the first session
- Send behavioral push notifications, triggered by what shoppers actually do
- Surface loyalty inside the app, where customers can see it
- Offer subscriptions and replenishment for consumables
- Use post-purchase education to bring buyers back
- Create app-exclusive access to justify the install
Each targets a specific point where shoppers otherwise drop off. Here's how the highest-retention stores put them to work.
Here's how the highest-retention stores put them to work.
1. Get users to value in the first session
Most churn happens in the first 24 hours. A shopper installs, opens the app once, doesn't immediately see why it's better than the mobile site, and never returns.
The fix for mobile app user retention is to make the first session deliver something the web can't. Faster browsing, a personalized entry point, or guided discovery that gets them to a relevant product in seconds rather than menus.
- Skip the long sign-up wall. Let people browse first, prompt for account creation at a natural moment.
- Make the speed advantage obvious in the first few taps, since that's the app's core promise over the web.
The user should feel the payoff before they've decided whether to keep the app. The ecommerce personalization trends shaping 2026 go deeper on real-time, first-session relevance.
2. Send behavioral push notifications
Push is the app's single biggest retention advantage over web, and the fastest way to get uninstalled if misused.
The difference is behavioral targeting.
- Trigger on behavior: cart abandonment, browse abandonment, back-in-stock, price drops.
- Time around the individual's habits, not a single send-to-all hour.
- Cap frequency and let users tune it. A relevant push retains; an annoying one uninstalls.
Abandoned-cart notifications drive 31.3x more revenue per 1,000 sends than generic broadcasts, and the full push economics show why behavioral targeting is what makes the difference.
3. Surface loyalty inside the app
A loyalty program only drives retention if people can see it. Buried in a web account page, it's forgotten. Front and center in the app, points balance visible, rewards a tap away, it becomes a reason to open the app and a reason to buy again to hit the next tier.
Svaha USA layered loyalty and referrals into its rebuilt app and moved its repeat purchase rate from 31.3% on web to 43% in the app.
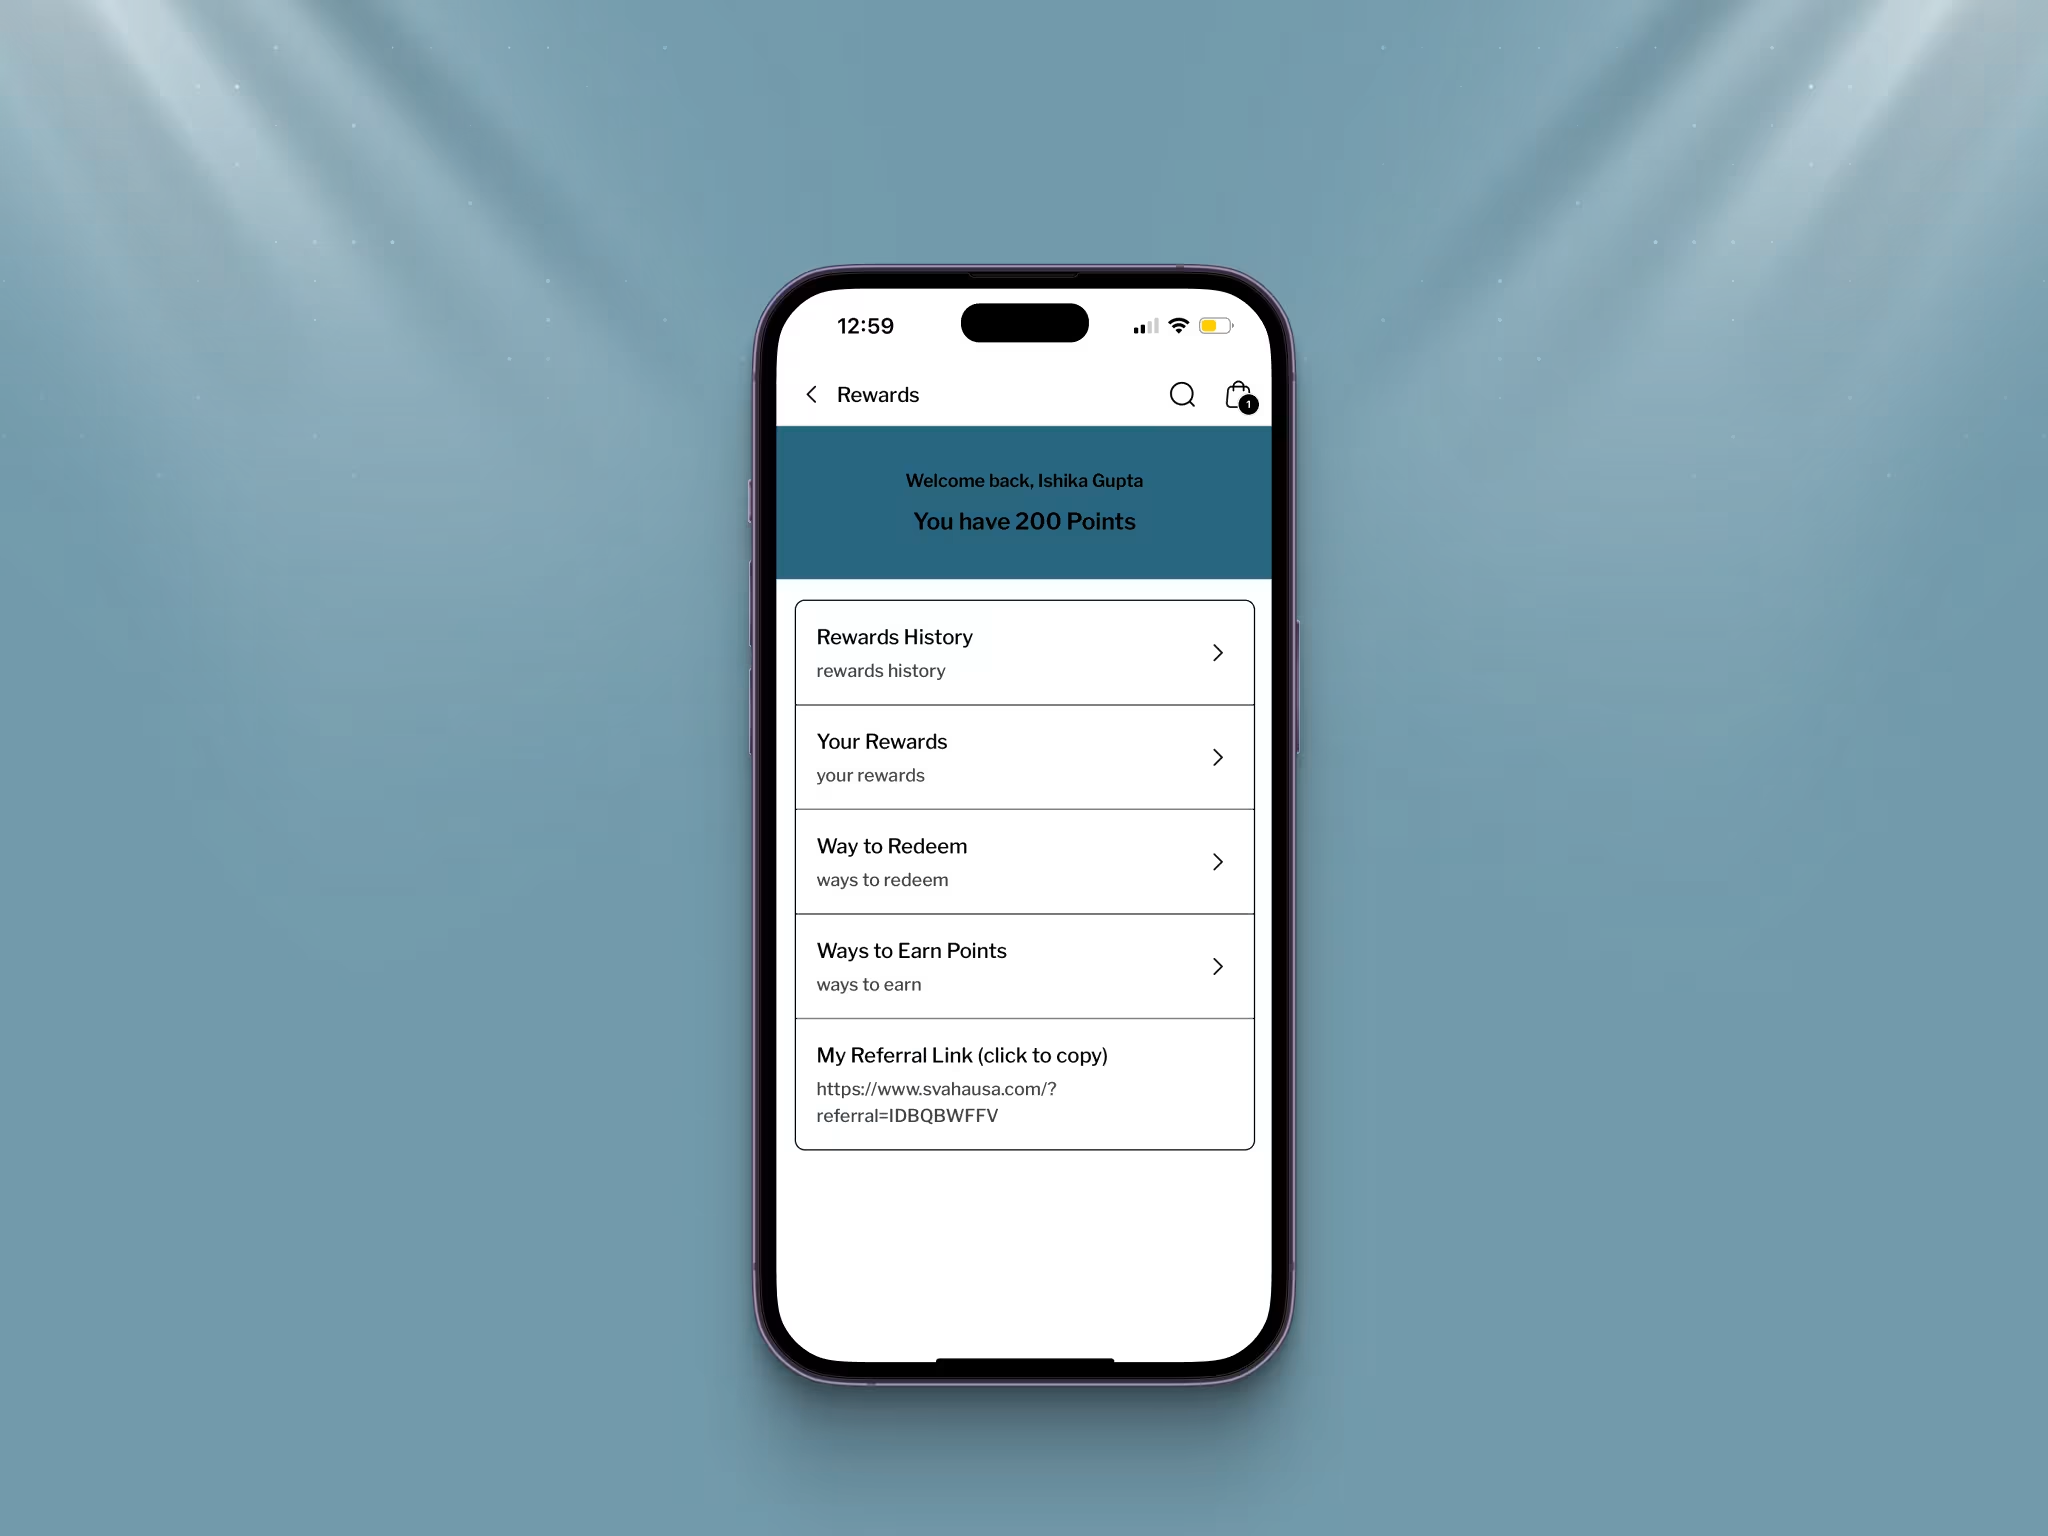
The app is the ideal home for loyalty because it's the one channel that's always one tap away on the customer's phone.
4. Offer subscriptions and replenishment
For any consumable, a subscription is the strongest retention mechanic there is, because it turns a decision into a default. The app makes subscriptions manageable in a way email and web struggle with: pause, skip, swap, and reorder all live in one place the customer already has installed.
Replenishment reminders work especially well because they arrive exactly when the customer needs the product, not when a campaign calendar says so.
5. Bring buyers back with post-purchase education
The moment after purchase is the highest-intent, lowest-effort retention window a store has, and most waste it. A buyer who just paid is the likeliest person to buy again. Post-purchase content, how to use the product, what pairs with it, order tracking that lives in the app, gives them a reason to keep opening it between orders.
Anatomie, a US premium travel-apparel brand, added an AI size guide that cuts fit uncertainty before checkout. The result was 5x higher customer lifetime value.
6. Create app-exclusive access
If the app offers nothing the website doesn't, there's no reason to keep it installed. App-exclusive drops, early access to launches, or app-only pricing give shoppers a concrete reason to stay, and to turn on notifications so they don't miss out.
- Run early access or exclusive drops that are only available in the app.
- Use app-only offers to justify the install and the notification opt-in.
- Signpost the exclusivity so users know the app is where the good stuff happens first.
Exclusivity compounds with push: once a user opts in for drop alerts, you've got a retained, reachable customer for every future launch.
{{cta}}
How top online stores win mobile app retention (real examples) 2026
App shoppers come back more, and buy more, than the same brand's web shoppers. Across 250+ brands, repeat purchases made up 32% of native-app orders. The strategies above aren't theory; they're what the highest-retention stores already run.
Here are four US brands doing it, and the numbers they moved.
1. Kut from the Kloth: loyalty and post-purchase capture
The denim brand's strategy was to move first-time buyers straight into the app, where loyalty and re-engagement live. The result was one of the sharpest app-versus-web gaps we've seen:
- 5.4% app conversion rate versus 2.3% on web
- 10% higher average order value in the app
As founder Steve Morales put it, getting customers into the app right after that first purchase drove higher lifetime value, conversion, and order value.
2. Svaha USA: loyalty and referrals
Svaha, a US apparel brand, already had an app but it was stuck near 10% of revenue, held back by broken filters and loyalty friction. Rebuilding around visible loyalty, referrals, and reliable rewards turned it into a genuine repeat-purchase engine:
- Repeat purchase rate rose from 31.3% on web to 43% in the app
- 42% higher lifetime value among app customers
- 3x higher conversion and 20% higher AOV versus web
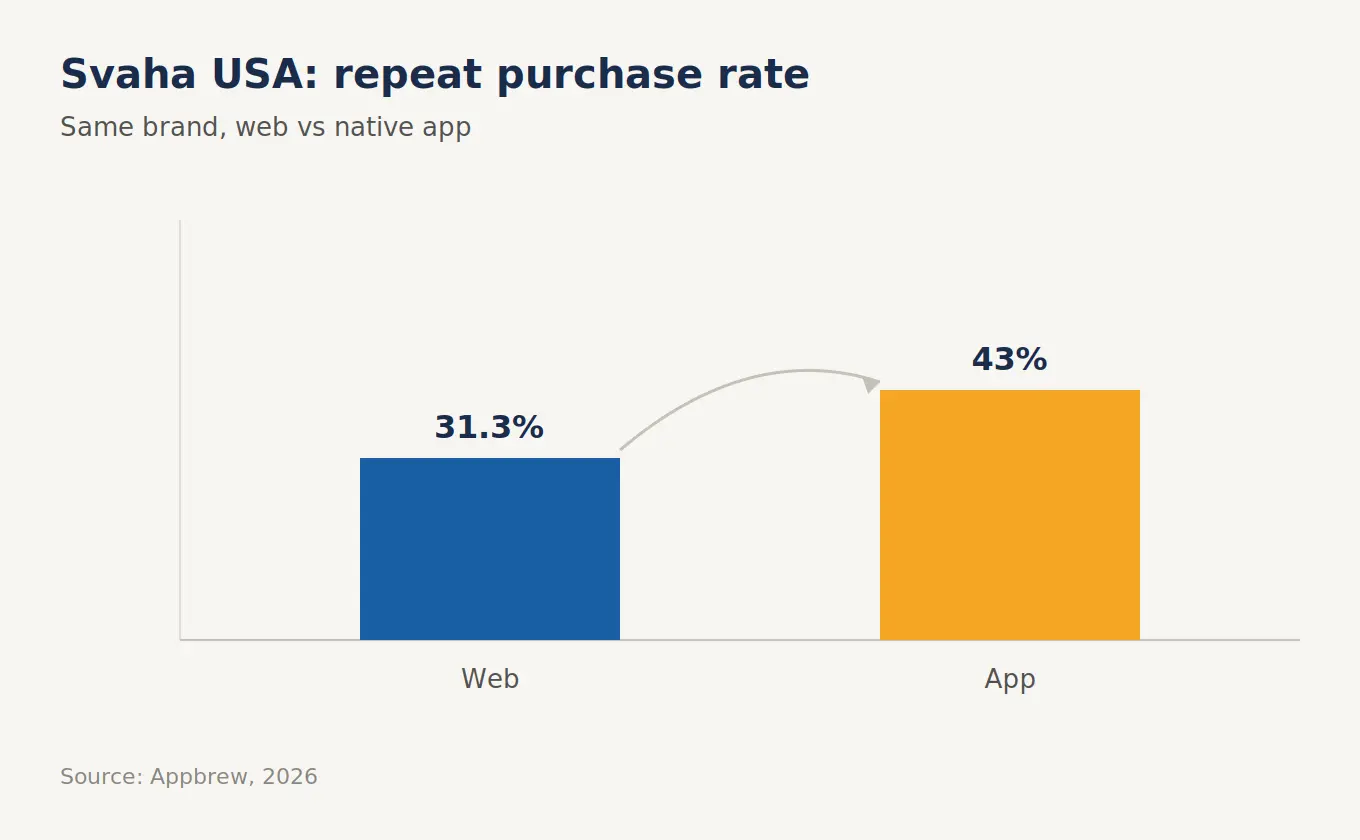
The lesson maps straight to strategy three: when loyalty and rewards are visible and easy inside the app, people come back to use them.
3. Dermaclara: first-session value and subscriptions
Dermaclara sells skincare that needs explaining, so a static catalog left shoppers with unanswered questions. An in-app AI concierge, "Clara," gave every user a guided first session, and native subscriptions kept them coming back:
- 3.5x growth in app-driven revenue
- 5.5x increase in engagement
- 32% higher conversion
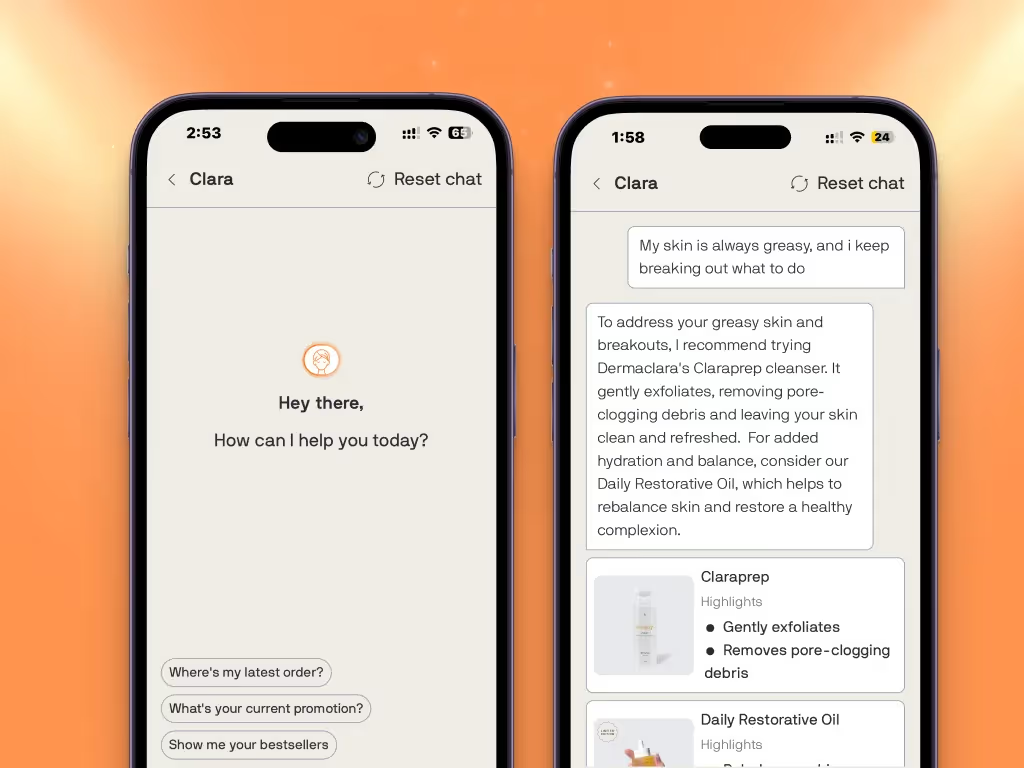
Clara nails strategy one, getting users to value in the first session, while native subscription management delivers strategy four. Together they turned browsing into a guided, repeatable habit.
4. Anatomie: post-purchase education and returns reduction
The premium travel-apparel brand faced a classic apparel problem, fit uncertainty driving returns and hesitation. By building an AI size guide and post-purchase discovery into the app, Anatomie turned first-time buyers into high-value repeat customers:
- 5x higher lifetime value from app customers
- 3x higher conversion than web
- 50% higher average order value
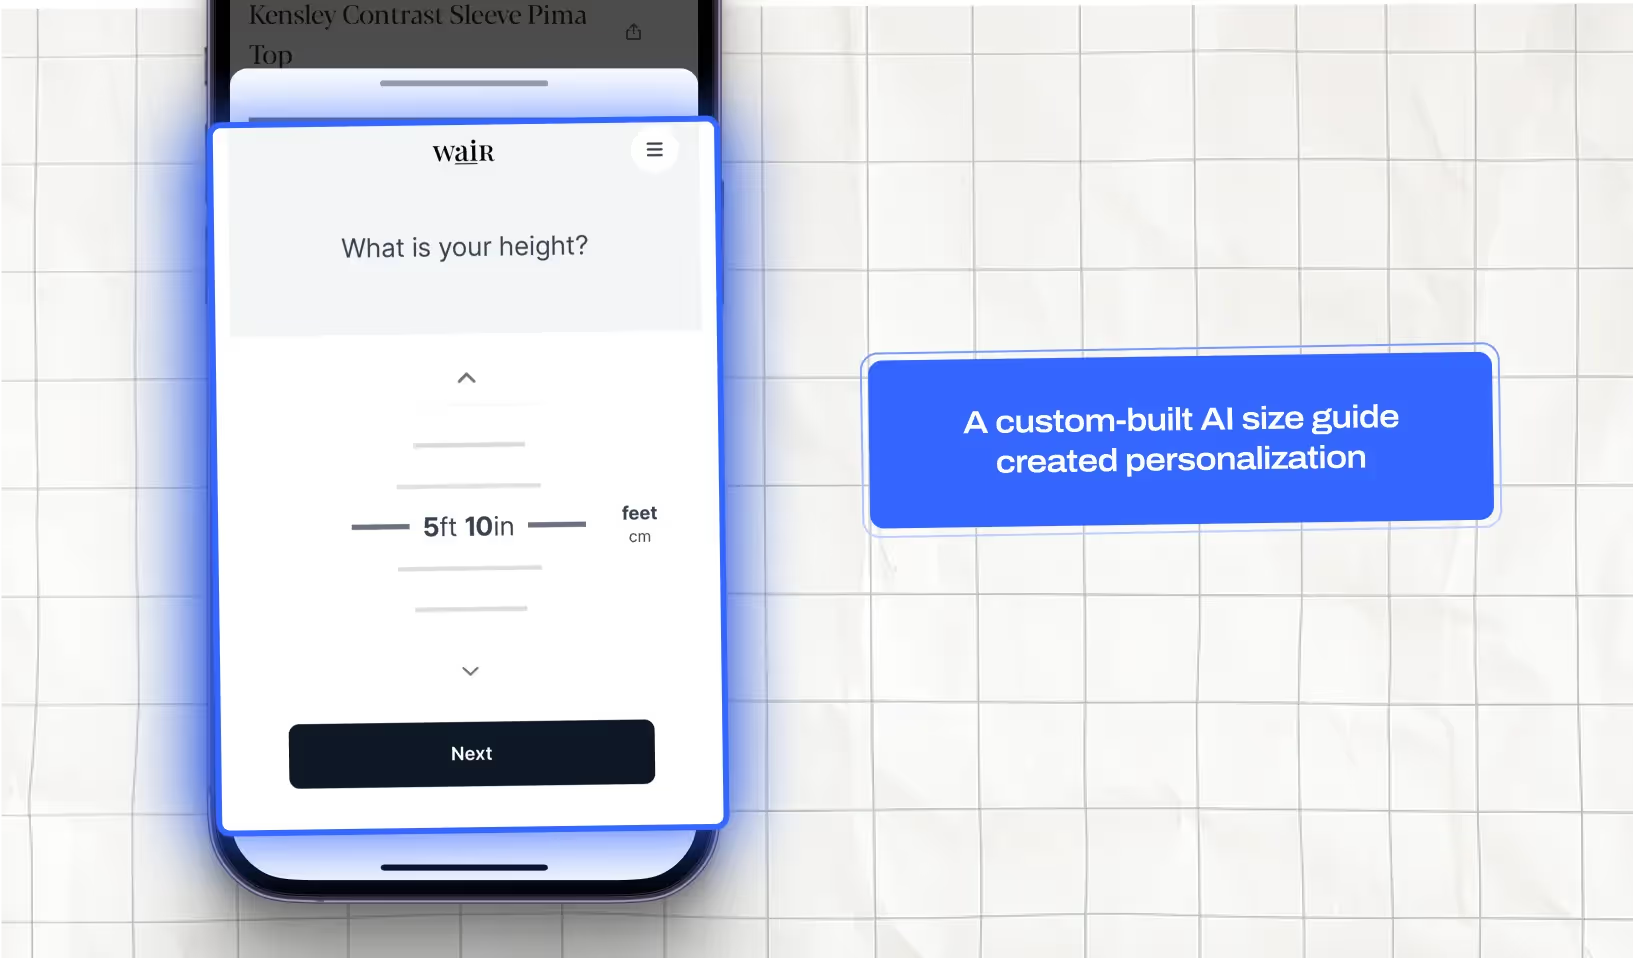
The AI size guide did double duty: it cut returns by helping people buy the right size, and it built the kind of confidence that brings shoppers back for the next trip.
How to increase app retention rate
Increasing your app retention rate comes down to a repeatable loop: measure your baseline, fix the first session, layer on push and loyalty, add subscriptions where they fit, then give people app-only reasons to return. Work it in order. There's no point running exclusive drops if users churn before they ever see one.
Here's the sequence.
- Measure your baseline first. Pull your Day-1, Day-7, and Day-30 retention by cohort, and segment it by buyers versus browsers. You can't improve a number you haven't isolated.
- Fix the first session. This is where most churn happens, so it's where the biggest gain is. Get users to value fast: browsing before sign-up walls, a guided or personalized entry point, obvious speed.
- Layer on behavioral push and visible loyalty. These are the two highest-leverage retention mechanics an app has. Trigger push on real behavior, and put loyalty where people can see it.
- Add subscriptions and replenishment for any consumable or repeat-purchase product, with self-serve controls so subscribers stay subscribed.
- Give app-only reasons to return. Early access, exclusive drops, and app-only offers turn a one-time installer into a repeat opener.
Start where your curve breaks
You don't have to run all five steps at once. Look at your own retention curve and start where it drops hardest:
- Steep Day-1 to Day-7 fall means an onboarding and first-session problem. Start there.
- Decent early retention but weak repeat purchases means the app is sticky but not commercial. Prioritize loyalty and subscriptions.
- Good retention overall but low installs is a different problem entirely, an acquisition one, not a retention one.
Fix the biggest leak first, measure again, then move to the next. Retention work is a loop, not a launch.
How to calculate app retention rate
To calculate app retention rate, divide the number of users still active on a given day by the number who installed on day zero, then multiply by 100.
Retention rate = (users active on day N ÷ users who installed on day 0) × 100
If 1,000 people installed your app on March 1 and 40 of them opened it on March 31, your Day 30 retention is 4%.
Three ways to measure it
The formula stays the same, but there are three lenses, and they answer different questions.
|
Method |
What it counts |
Best for |
|
Day-N (classic) |
Users active on one specific day (Day 1, 7, 30) |
Spotting where the curve drops |
|
Rolling |
Users active on day N or any day after |
Apps used irregularly, like shopping apps |
|
Range (bracket) |
Users active at least once within a window |
Smoothing out day-to-day noise |
For online stores, rolling or range retention often paints a fairer picture than classic Day-N. Shoppers don't open a store app every single day, so a strict "were they active on exactly Day 30" test can undercount people who are still engaged, just not daily. If your app looks like it's retaining poorly on classic Day-N, check the rolling number before you panic.
What to track it with
The best tools for tracking app retention and churn are cohort-based product-analytics platforms. Mobile-focused analytics tools built into your app platform all group users by install week and chart each cohort's retention curve over time, which is what you need to see where drop-off happens.
What matters is less the specific tool than what you ask it to show:
- Retention by cohort, so you can see how each month's installs hold up over time
- Retention by acquisition source, so you know which channels bring back users who actually stick, not just users who install
- Retention by segment, above all buyers versus browsers, which is the split that matters most for a store
That last one is the one most brands miss. Segment retention by whether the user has purchased and you'll often find your real repeat customers are far stickier than the headline number suggests.
How Appbrew helps Shopify brands improve mobile app retention
Retention mechanics only matter if a store can actually run them without a developer for every change. That's the gap Appbrew fills: it's an AI-native app builder for Shopify and Shopify Plus, built so marketing teams can run the retention playbook, push, loyalty, subscriptions, exclusives, themselves.
More than 250 Shopify brands run their apps on Appbrew, and the levers from this guide are built in:
- Unlimited push notifications to run the behavioral, back-in-stock, and cart triggers that drive repeat opens
- 120+ integrations, including loyalty, subscriptions, reviews, and analytics, so the tools you already use surface inside the app
- Milo, an AI growth assistant that segments your audience and drafts and schedules push campaigns
- AI-led personalization and an AI size chart that speed up the first session and cut returns
- Native video shopping and an app-only promotion engine for the exclusive drops, discounts, and bundles that justify the install
The brands earlier in this guide, Kut from the Kloth, Svaha USA, Anatomie, and Dermaclara, all run on Appbrew, and their repeat-purchase and engagement results came from putting these mechanics to work.
{{cta2}}
FAQs
What is a good retention rate for an app?
For most apps, a good Day-30 retention rate is anything above the cross-industry median of about 4%. Standards vary sharply by category, though. Social and messaging apps often hold 15-20% at Day 30, while ecommerce apps typically retain 3-6%. The most useful benchmark is your own app's trend over time, not the industry average.
What is the average mobile app retention rate for ecommerce?
Ecommerce apps retain roughly 22-26% of users at Day 1, 6-10% at Day 7, and 3-6% at Day 30. Shopping apps sit lower than social or productivity apps because people don't shop every day, so a 3-6% Day-30 rate is normal and healthy for an ecommerce brand.
What are five ways to improve app retention?
Five proven strategies: get users to value fast in the first session, send behavioral push notifications triggered by real activity, surface loyalty inside the app, offer subscriptions and replenishment for repeat-purchase products, and use post-purchase education to bring buyers back. Each targets a specific point in the customer journey where shoppers otherwise drop off.
Does a mobile app retain customers better than mobile web?
For online stores, yes. App shoppers consistently return and repeat more than the same brand's web shoppers, because the app is the only owned channel with push notifications, saved login, and loyalty always one tap away. Across 250+ Shopify brands, repeat purchases made up 32% of native-app orders (Appbrew, 2026).
How do you calculate Day-30 retention?
Divide the number of users still active on day 30 by the number who installed on day zero, then multiply by 100. If 1,000 people install your app and 40 are still active 30 days later, your Day-30 retention is 4%. Always measure the same install cohort, not users who joined later.